
 A farm can look healthy from the ground while some parts of the field are already struggling. One section may have weaker vegetation, another may have poor nutrient availability, while a third may be affected by water stress or disease.
This is where NDVI analysis for agriculture in Nigeria becomes useful. By combining multispectral drone imagery with vegetation-index analysis, farmers and agronomists can map differences in crop condition and identify areas that require closer investigation.
What Is NDVI?
NDVI stands for Normalized Difference Vegetation Index. It is a vegetation index calculated from red and near-infrared reflectance.
The formula is:
NDVI = (NIR − Red) / (NIR + Red)
Healthy vegetation generally absorbs a large amount of visible red light for photosynthesis while reflecting more near-infrared radiation. NDVI uses this contrast to provide an indication of vegetation response across an area.
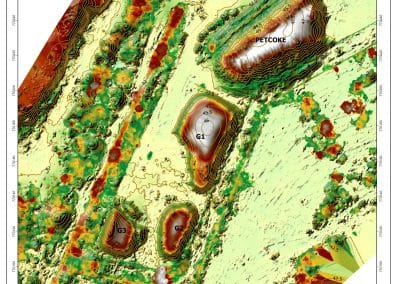
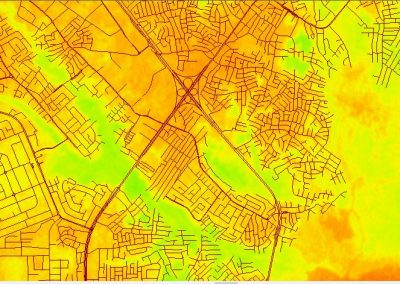
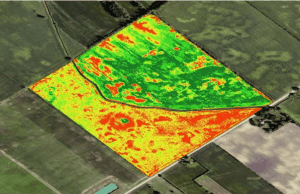
When NDVI is generated from drone imagery, every part of a field can be assigned a value. The result is a georeferenced vegetation map showing where crop conditions vary.
How Drone NDVI Mapping Works
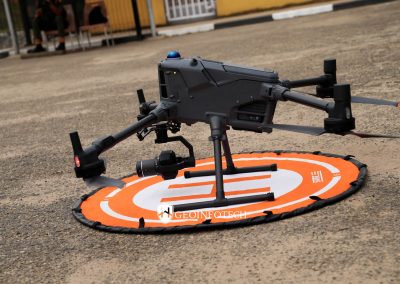
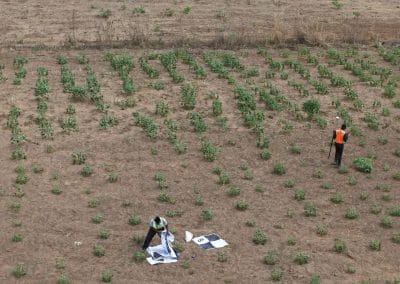
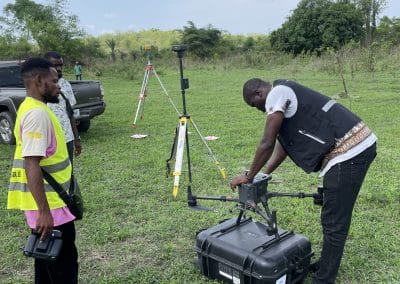
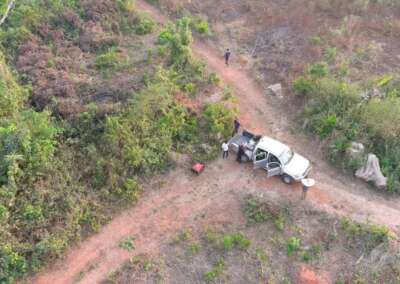
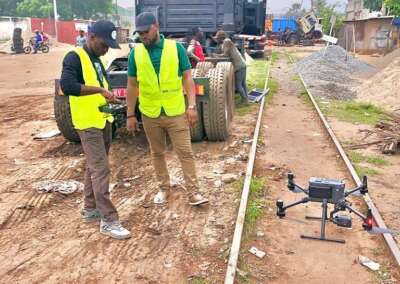
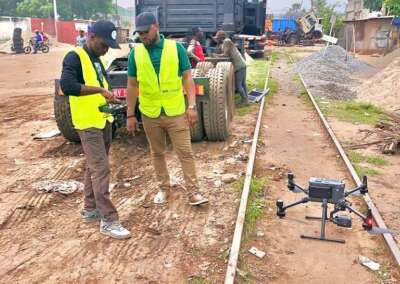
A drone equipped with a suitable multispectral camera flies over the agricultural area and captures overlapping images.
The imagery is then processed to create an orthomosaic and calculate NDVI. The resulting map can show spatial differences in vegetation response at a much finer resolution than many satellite products.
A typical workflow involves:
- Flight planning: The farm boundary, flight altitude, overlap and survey requirements are defined.
- Image collection: The drone captures multispectral imagery containing red and near-infrared information.
- Image processing: The individual images are aligned and processed into a georeferenced dataset.
- NDVI calculation: Red and NIR reflectance are used to generate the vegetation index.
- Crop assessment: Areas with unusual or low vegetation responses are identified for further investigation.
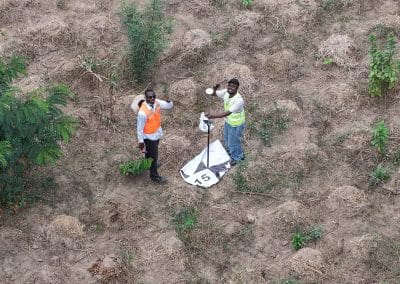
- Field verification: Farmers or agronomists inspect selected locations to determine what is actually causing the observed variation.
What Can NDVI Reveal About Crop Stress?
NDVI is particularly useful for identifying where crop performance differs across a field.
Lower or abnormal NDVI patterns may be associated with reduced vegetation vigour, sparse crop establishment, water stress, nutrient limitations, disease, pest damage or other factors.
However, NDVI does not tell you exactly which problem is responsible. The same spectral response can have several possible causes. Therefore, an NDVI map should be treated as an early-warning and targeting tool rather than an automatic diagnosis.
Detecting Nutrient Problems
Nutrient availability can influence plant growth, chlorophyll and canopy development. This can produce detectable differences in multispectral imagery.
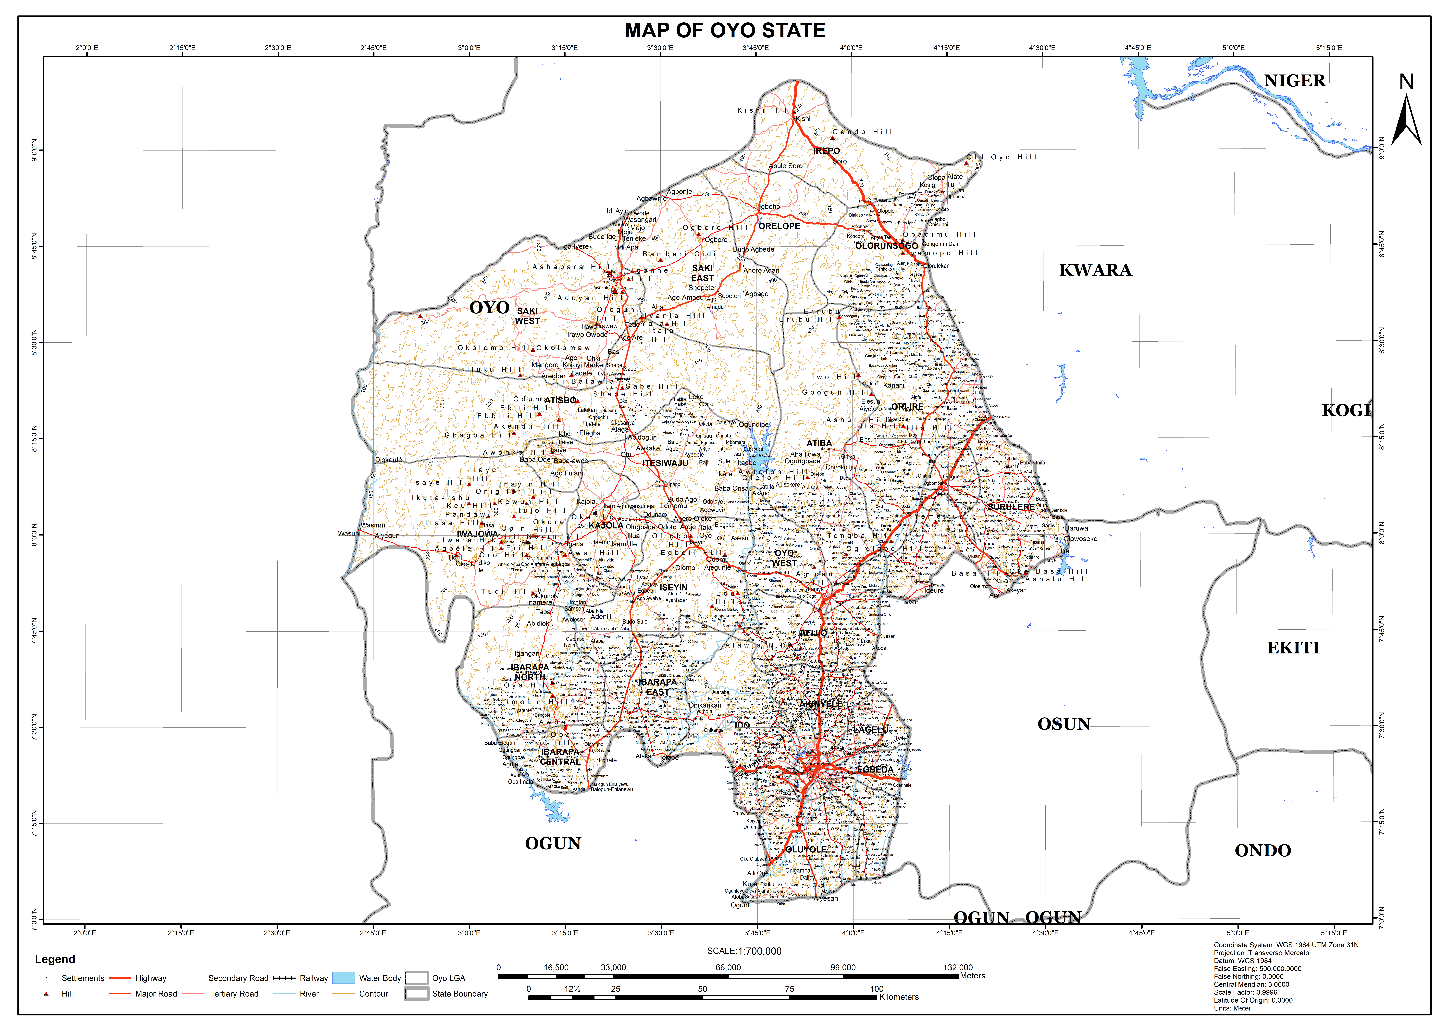
Recent research in Oyo State, Nigeria, used UAV multispectral imagery to investigate nitrogen deficiency in maize. The study found that red-edge-based vegetation information showed strong relationships with leaf nitrogen content at different growth stages.
This demonstrates how drone-based spectral analysis can support more targeted investigation of nutrient variability.
Still, farmers should combine the imagery with soil information, crop observations and appropriate agronomic tests before applying fertiliser based solely on an NDVI pattern.
Can NDVI Detect Crop Disease?
Disease can affect leaf colour, chlorophyll, plant structure and overall crop vigour. These changes can influence vegetation-index values.
Recent UAV research has demonstrated the potential of combining multispectral bands and vegetation indices, including NDVI and NDRE, with machine learning to distinguish healthy and diseased maize and classify particular diseases.
However, there is an important distinction. NDVI can help identify areas showing abnormal vegetation responses, but it cannot by itself confirm the specific disease.
Field scouting, RGB imagery, laboratory testing or specialist agronomic assessment may still be required.
Identifying Poor Growth and Uneven Fields
One of the simplest applications of NDVI mapping is identifying areas where crops are developing differently.
For example, an NDVI map might reveal a consistently weaker zone along one section of a farm. That area could then be investigated for soil differences, drainage problems, compaction, poor emergence, pests or inadequate inputs.
Repeated drone surveys can make this even more useful because farmers can compare vegetation patterns at different stages of the growing season.
Why NDVI Matters for Nigerian Agriculture
Nigeria has diverse agricultural systems ranging from smallholder farms to large commercial operations. In both cases, knowing where crop conditions vary can improve the efficiency of field scouting and monitoring.
A drone can cover a farm relatively quickly and produce a detailed spatial record that can be compared with later surveys. This creates an opportunity to move from general observations such as “the farm looks stressed” to more specific questions such as where is the stress occurring, how large is the affected area, and how has it changed over time?
Research on smallholder farms in Southwest Nigeria has already explored low-cost drone-based multispectral imaging for crop-health monitoring, including NDVI-based analysis.
From NDVI Maps to Farm Decisions
The real value of NDVI analysis is not the map itself. It is what the information helps the farmer do next.
An NDVI map can help prioritise field scouting, monitor crop development, compare different areas of a farm and identify zones that deserve further investigation. When combined with other vegetation indices, RGB imagery, thermal data, soil information and agronomic observations, it can provide a more complete picture of crop condition.
Geoinfotech provides drone-based agricultural mapping and multispectral analysis that can support NDVI-based crop monitoring and precision agriculture workflows.
For Nigerian farmers and agribusinesses, NDVI analysis for agriculture provides a practical way to turn high-resolution drone imagery into spatial information about crop variability. The strongest results come when the technology is used alongside field observations and agronomic knowledge, turning a vegetation map into an informed management decision.