CHAPTER ONE
Introduction
1.1 Background of the Study
Access to essential public services such as education and healthcare is a fundamental pillar of human development, poverty reduction, and improved quality of life globally (United Nations, 2023). These services are critical determinants of well-being and opportunity, directly influencing demographic trends, labor market participation, and overall socio-economic stability (World Bank, 2022). In the contemporary discourse on sustainable development, equitable access to quality education and health services is enshrined as a core tenet of the United Nations’ Sustainable Development Goals (SDGs), specifically Goal 3 (Good Health and Well-being) and Goal 4 (Quality Education) (United Nations, 2023). Despite international commitments and national policy frameworks, a persistent and often widening gap persists between the provision of these services and the actual needs of populations, particularly in rural, mountainous, and geographically isolated regions (Neutens, 2015).
This spatial inequity in service delivery is a global phenomenon, but its manifestations are deeply rooted in local geographic, infrastructural, and socio-economic contexts. Globally, Geographic Information Systems (GIS) have emerged as a powerful analytical tool for investigating and visualizing these disparities (Olofin, Olatunji, & Adeola, 2020). By integrating facility locations, transportation networks, and demographic data, GIS enables researchers and planners to move beyond simplistic metrics and develop a nuanced understanding of accessibility (Luo & Wang, 2003). Traditional methods relying on Euclidean (straight-line) distance have been widely criticized for failing to account for real-world mobility constraints imposed by terrain, road networks, and other barriers, leading to potentially misleading assessments of service coverage (Talen & Anselin, 1998). Consequently, network-based service area analysis, which models travel along actual infrastructure pathways, has become the standard for robust accessibility assessment (Luo & Qi, 2006).
The challenge of spatial inequity is particularly acute across the African continent. Rapid urbanization, coupled with vast rural areas characterized by poor infrastructure, creates complex accessibility landscapes. Studies conducted across various African nations have consistently documented significant disparities in the distribution of health facilities, with concentrations often favoring urban centers at the expense of peri-urban and remote rural communities (Adeyemi, Oladunjoye, & Akinwumi, 2021). For instance, research in Ethiopia has highlighted how topography and inadequate transport infrastructure severely limit access to primary health care (Tesfaye, Alemu, & Getachew, 2020), while studies in Ghana have used GIS to map inequalities in access to maternal health services (Amoako, Boateng, & Asante, 2019). The issue extends to education, where factors like school density, household income, and travel time to the nearest school are significant predictors of enrollment and retention rates, especially for girls (Mushi, Mwakalila, & Mgaya, 2021). The overarching conclusion from much of this research is that accessibility is not merely a function of facility count but is heavily mediated by transportation infrastructure, population distribution, and the physical geography of the region (Kwan, 2012).
In Nigeria, a country grappling with issues of rapid population growth, uneven regional development, and significant resource allocation challenges, the application of GIS to assess public service distribution has gained considerable traction (Adekunle, Ogunlana, & Oyediran, 2019). Several studies have leveraged geospatial techniques to evaluate the spatial equity of health and educational facilities. Research in southwestern Nigeria revealed a marked clustering of health facilities in urban hubs, leaving large segments of the rural population with limited access (Adeyemi et al., 2021). Similarly, investigations in northern Nigeria have demonstrated how seasonal variations in road conditions and challenging topography exacerbate educational access gaps for children living in remote communities (Omondi, Adebayo, & Chukwu, 2020). National policies, such as the Universal Basic Education (UBE) program and the National Health Development Plan, explicitly call for equitable distribution of resources (Universal Basic Education Commission [UBEC], 2022; Federal Ministry of Health, 2021). However, implementation often lacks the spatially explicit targeting required to address localized disparities effectively. The growing body of GIS-based research in Nigeria serves to bridge this gap, providing empirical evidence that can inform more strategic and equitable planning decisions at both state and local government levels (Olofin et al., 2020).
Within Nigeria, the state of Taraba presents a compelling case for such analysis. Located in the northeastern geopolitical zone, Taraba shares an international border with Cameroon and is characterized by diverse agro-ecological zones and significant ethnic diversity (National Bureau of Statistics, 2023). While it possesses valuable natural resources, including barite, which is utilized by the oil and gas industry, the state faces substantial developmental challenges (Solid Minerals Development Fund, 2022). Research indicates that Taraba State experiences high levels of economic inequality, with several of its Local Government Areas (LGAs) recording very high Gini values, pointing to deep structural inequalities that demand targeted interventions (Ibrahim & Mohammed, 2021). Furthermore, studies focusing on Taraba State have identified specific health-related challenges, including a lack of access to healthcare facilities, inadequate health manpower, and high costs associated with healthcare delivery (Yusuf, Bello, & Suleiman, 2022; Danjuma, Adamu, & Ibrahim, 2021). The state’s budgetary allocations reflect a strong emphasis on sectors crucial for human capital development, with significant funds directed towards education and health (Taraba State Government, 2023).
Sardauna Local Government Area, situated in the southeastern part of Taraba State, is emblematic of many of the complexities found within the broader state and region. It lies predominantly within the Mambilla Plateau, a highland area known for its rugged topography, steep gradients, and deeply incised valleys (Oguntoyinbo & Ogundare, 2018). This challenging physical geography profoundly influences settlement patterns, leading to dispersed communities spread across hilltops, valley floors, and plateau surfaces. The road infrastructure in Sardauna remains sparse and poorly maintained, with many routes becoming impassable during the rainy season, thereby restricting mobility and increasing the cost and duration of travel (Abdullahi & Musa, 2022). The population is largely rural, with livelihoods centered on subsistence agriculture, livestock rearing, and small-scale trade (Sardauna LGA Development Report, 2023). Settlements are unevenly distributed, with higher population densities concentrated along major road corridors and historical trading hubs, while the remote eastern and western peripheries remain sparsely populated yet geographically isolated (Ibrahim & Mohammed, 2021). Despite the presence of educational and health facilities, anecdotal evidence and preliminary observations suggest significant gaps in service coverage, particularly for those living in remote and high-elevation communities. This combination of challenging terrain, limited transport connectivity, and a dispersed population makes Sardauna an ideal, yet difficult, case study for evaluating the spatial accessibility of essential services.
1.2 Statement of Research Problem
Despite national policies and programs aimed at ensuring equitable access to education and healthcare, significant spatial disparities persist in many parts of Nigeria, particularly in rural and topographically complex regions like Sardauna Local Government Area (LGA). The provision of these essential services is often guided by administrative convenience or historical development patterns rather than a systematic analysis of where the population resides and how they can realistically access facilities. This disconnect between service provision and population need creates profound inequities, leaving thousands of residents, especially those in remote and underserved communities, without timely and adequate access to schools and health clinics. In Sardauna LGA, the challenging landscape of the Mambilla Plateau, combined with a limited and often deteriorating road network, likely exacerbates these access problems (Abdullahi & Musa, 2022). Without a precise, geospatially grounded understanding of these accessibility gaps, local planners and policymakers are forced to rely on incomplete information, making it difficult to prioritize investments in new facilities or infrastructure effectively. This leads to inefficient use of scarce resources and perpetuates cycles of marginalization for vulnerable populations. Therefore, there is a critical need for a systematic and evidence-based assessment to quantify the extent of service inaccessibility, identify the most underserved areas, and provide a spatially explicit foundation for more equitable and effective public service planning in Sardauna LGA.
1.3 Research Questions
To address the stated problem, this study seeks to answer the following specific research questions:
- What is the spatial pattern of distribution of educational and health facilities across Sardauna LGA?
- What is the level of accessibility to educational and health facilities when measured along the existing road network?
III. How many residents live within different levels of accessibility (high, moderate, low) to these essential services?
1.4 Aim and Objectives
The central aim of this study is to conduct a comprehensive geospatial assessment of the accessibility of educational and health facilities in Sardauna Local Government Area, Taraba State, Nigeria, using GIS-based network analysis. The specific objectives of the study are:
- To analyze the spatial distribution of educational and health facilities within the LGA:
- To evaluate the accessibility of these facilities using road network-based service area analysis:
III. To assess the population residing within defined accessibility thresholds to determine coverage and identify underserved areas.
1.5 Hypothesis
HO: There is a significant portion of the population in Sardauna LGA that resides outside of reasonable walking distance to both educational and health facilities, resulting in substantial underserved populations, particularly in remote and highland communities.
HA: The distribution of these facilities is clustered along major road corridors, leading to stark contrasts in accessibility between accessible central areas and geographically isolated peripheral regions.
1.6 Justification of the Study
It addresses a critical knowledge gap concerning the spatial distribution and accessibility of essential services in Sardauna LGA, a highland, rural, and topographically complex region. While general challenges in Taraba State have been noted, localized, geospatially-detailed assessments for Sardauna are scarce (Yusuf et al., 2022; Danjuma et al., 2021).
By employing network-based GIS analysis, the study provides a methodologically rigorous and realistic evaluation of accessibility, moving beyond simplistic measures to account for the real-world constraints of the road network and terrain (Luo & Qi, 2006). This approach offers a far more accurate picture of service coverage than traditional methods.
The findings of this research will generate actionable, spatially explicit evidence that can directly support local government planners, policymakers, and development agencies. By identifying specific underserved communities and quantifying the scale of the problem, the study provides a data-driven basis for prioritizing infrastructure investment, strategically locating new facilities, and optimizing the allocation of limited public funds. Finally, the study contributes to the broader discourse on spatial justice and the achievement of the Sustainable Development Goals (SDGs) by providing concrete evidence of spatial inequities and offering a pathway toward more equitable development in line with SDG 3 (Good Health and Well-being) and SDG 4 (Quality Education) (United Nations, 2023).
1.7 Scope of the Study
This study is confined to Sardauna Local Government Area, located in the southeastern part of Taraba State, Nigeria. The LGA is bordered by Jalingo and Wukari LGAs in the north, Takum LGA in the south, and Cameroon in the east and south (National Boundary Commission, 2022). It covers an administrative area of approximately 3,450 square kilometers (Sardauna LGA Development Report, 2023). The research focuses exclusively on assessing accessibility to two categories of public services: educational facilities (from pre-primary to secondary levels) and health facilities (including primary health care centers and general hospitals). The study utilizes the most recent available data for facilities, population, and road networks to ensure relevance. It does not, however, consider non-road-based modes of transport, seasonal variations in road conditions beyond what is captured in the static road dataset, or qualitative user perceptions of access.
1.8 Limitations to the Study
A primary limitation of this study is the potential accuracy and completeness of the input datasets. The point locations of educational and health facilities were obtained from official records, which may contain errors, outdated information, or omissions. Similarly, the road network data, though validated against satellite imagery, was primarily sourced from OpenStreetMap (OSM), which can be inaccurate in position, topology, and completeness, especially in less-mapped rural regions (Abdullahi & Musa, 2022). The population data, while at a high resolution, represents a static snapshot and may not fully capture internal migration or demographic shifts within the LGA. The analysis assumes uniform travel speeds and does not account for real-time traffic or seasonal road deterioration, which could affect actual travel times. These limitations, while acknowledged, represent inherent challenges in conducting large-scale geospatial analyses with publicly available or administratively sourced data.
1.9 Study Area
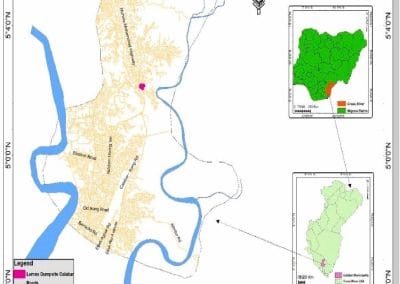
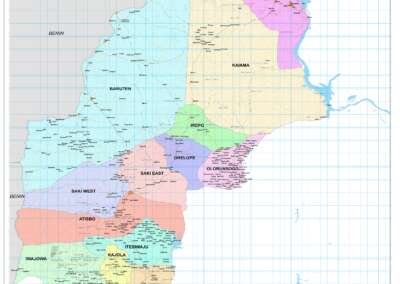
Sardauna Local Government Area is one of the sixteen local government areas in Taraba State. The local government area located on the south-east of the state is bounded by the Republic of Cameroon on the southern, eastern and almost half of its western part, and Gashaka and Kurmi Local Government Areas on the north and south-west respectively (Ahmadu et al., 2009). Sardauna Local Government Area has a total landmass of about 3,765.2km and lies on the latitude 5° 31′ and 7° 18′ north and on the longitude 10° 18′ and 11° 37′ east with an altitude of about 1,850m above the sea level (Ciroma, 2009; Wikipedia, the free encyclopedia, 2011).
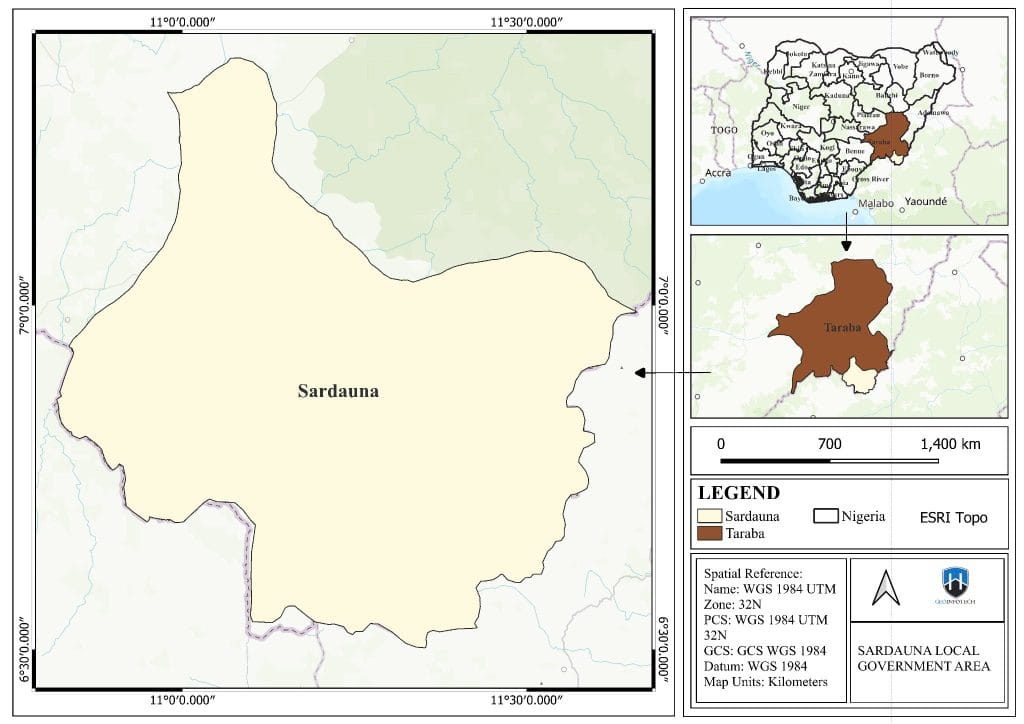
Figure 1.1: Study area map
Source: Author
1.9.1 Climate
Sardauna LGA is located within the highland region of Nigeria, which significantly influences its climate. Situated on the Mambilla Plateau, the area experiences a temperate climate compared to the lowlands of Nigeria (Oguntoyinbo & Ogundare, 2018). The elevation moderates temperatures, making it cooler and more comfortable year-round.
1.9.1.1 Temperature
Average annual temperatures in Sardauna are notably lower than in most other parts of Nigeria. Due to its high elevation, daytime highs are generally pleasant, while nights can be cool. The plateau environment creates a more stable thermal regime, free from the intense heat characteristic of the southern and northern savanna belts. This climatic condition also supports unique agricultural practices and biodiversity. This part of the country, owing to its altitude, is relatively cool; most days in the dry season, the temperature will reach 20 to 23° C and drop to 16 to 18° C at night, whilst in the wet season these averages fall a couple of degrees to about 14 to 13° C. (Ciroma, 2009; Wikipedia, the free encyclopedia, 2011).
1.9.1.2 Rainfall and Relative Humidity
The study area receives substantial rainfall, characteristic of a tropical highland climate. The Mambilla Plateau acts as a rain-generating area, receiving orographic lift that enhances precipitation. Annual rainfall totals are high, supporting lush vegetation and agricultural activities. High humidity is common throughout the year, a direct result of the proximity to the Guinea-Congo forest biome and the region’s elevation. This consistent moisture is vital for the agricultural economy but can also contribute to the proliferation of water-borne diseases and dampness-related issues (Abdullahi & Musa, 2022).
1.9.2 Drainage
The rugged topography of Sardauna, with its deeply incised valleys and dissected plateau surfaces, gives rise to a dense and complex drainage network. Numerous streams and rivers originate on the plateau, carving through the landscape and contributing to larger river systems. This intricate hydrology is crucial for agriculture and domestic water supply, but also poses challenges related to soil erosion and landslides, particularly on steep slopes and during periods of heavy rainfall.
1.9.3 Vegetation and Agriculture
Sardauna Local Government Area is highly saturated with green-lush vegetation. The high altitude and favorable climate support a rich mosaic of vegetation. The Mambilla Plateau is home to montane grasslands and patches of sub-alpine flora. The surrounding lower slopes transition into moist evergreen and semi-deciduous forests. The route to the Plateau and the terrain are widely fascinating given its scenic beauty, vegetation, and landscape, which charm various ethnic groups and tourists to the area (Ciroma, 2009; Wikipedia, the free encyclopedia, 2011).
This diverse ecosystem underpins a productive agricultural sector. Key crops grown in the area include potatoes, vegetables, maize, and beans, which thrive in the cool, fertile soils of the highlands. Livestock rearing is also a significant component of the local economy.
1.9.4 Economic Activities
The economy of Sardauna LGA is predominantly rural and agrarian. The mainstay of the local economy is subsistence agriculture, practiced by the majority of the population (Abdullahi & Musa, 2022). Cash crops such as coffee and pyrethrum are also cultivated, contributing to household incomes. Small-scale trading, both formal and informal, takes place in local markets located in central settlements. Given its location near the Cameroon border, cross-border trade may also play a minor role in the local economy (National Bureau of Statistics, 2023). The exploitation of natural resources like barite, while significant for the national economy, appears to have a less direct impact on the local populace of Sardauna compared to its agricultural base (Solid Minerals Development Fund, 2022).
1.9.5 Population
Sardauna LGA has a predominantly rural population whose settlement patterns are closely tied to the availability of arable land and proximity to transport routes (Abdullahi & Musa, 2022). In 2006, the Sardauna Local Government Area had a total population of 224,357, which comprised 112,060 males and 112,297 females ( National Bureau of Statistics, 2006). Population density varies significantly across the LGA. Higher concentrations are found in the central and more accessible parts of the plateau, particularly along major road corridors and around historical trading hubs. In contrast, the remote eastern and western peripheries, as well as high-elevation zones with steeper terrain, are characterized by sparse settlement distribution (Ibrahim & Mohammed, 2021). This uneven distribution, combined with the challenging terrain and limited transport infrastructure, presents significant logistical hurdles for the delivery of essential public services like education and healthcare, creating distinct pockets of vulnerability and underservice (Yusuf et al., 2022; Danjuma et al., 2021). The major ethnic groups on the plateau include: Mambilla, Kaka, Fulani, Panso, and Kambu. Hausa, Igbo, and Kanuri also live there. Mambilla and Fulani are the common languages spoken in Gembu Headquarters of the Sardauna Local Government of Taraba State (Kara, H. A et al., 2014).
Chapter Two
Literature Review
2.1 Literature Review
The literature review synthesizes existing research on the spatial accessibility of public services, contextualizing the current study within a global, African, Nigerian, and local framework. The theme of spatial inequity in service delivery is well-established, with a consensus emerging that accessibility is a complex interplay of geography, infrastructure, and policy.
Globally, the application of GIS for accessibility analysis has evolved significantly. Early work focused on developing indices to measure accessibility, such as the two-step floating catchment area (2SFCA) method, which accounts for both facility supply and population demand within a given catchment area (Luo & Wang, 2003). More advanced versions, like the E2SFCA, refine this by considering distance decay, giving closer facilities more weight than distant ones (Luo & Qi, 2006). While sophisticated, these grid-based methods require extensive computational resources and assumptions about travel behavior. In contrast, network-based service area analysis, the method adopted in this study, offers a more intuitive and computationally efficient way to visualize and quantify coverage, making it highly suitable for practical planning applications. The importance of moving beyond Euclidean distance is strongly advocated, with scholars emphasizing that topography, land use, and transport networks create “uncertain geographic contexts” that must be accounted for to avoid biased conclusions (Kwan, 2012).
The challenge of providing equitable services is particularly pronounced in Africa. Research across the continent demonstrates that urban-centric development policies often neglect rural populations. A study in South Africa highlighted significant disparities in access to healthcare, where rural residents faced longer travel times and fewer facility options compared to their urban counterparts (Mberu & Haregu, 2019). In Kenya, GIS was used to assess the accessibility of primary health care services, revealing that a large proportion of the rural population lived beyond a 5-kilometer walking distance, a threshold often considered acceptable in policy documents (Ochieng, Were, & Otieno, 2020). Similar patterns have been observed in education. In Tanzania, a study found that children’s access to school was significantly influenced by travel time, distance, and household wealth, with those living furthest away being less likely to attend school regularly (Mushi et al., 2021). The common thread in these studies is the critical role of infrastructure; poor road conditions, long distances, and a lack of reliable transport are consistently identified as major barriers to accessing essential services in rural Africa (Adeyemi et al., 2021).
Within Nigeria, the narrative is similar, with a growing body of GIS-based research illuminating the spatial dimensions of service inequity. A nationwide study mapping the spatial distribution of health establishments confirmed large inequalities in healthcare provision, with facilities disproportionately concentrated in the southwest and center of the country (Adeyemi et al., 2021). At a more localized level, research in Ibadan, Nigeria, analyzed the spatial dimensions of accessibility to general hospitals and found that residents living at longer distances faced significant barriers to care (Oladimeji, Adebowale, & Yusuf, 2021). Another study in Oyo State used GIS to evaluate the accessibility of primary healthcare facilities, providing a model for similar analyses elsewhere in the country (Adekunle et al., 2019). The Nigerian context is further complicated by rapid population growth and uneven development, making evidence-based planning even more critical (World Bank, 2022). Studies have also begun to explore the intersection of these issues with other challenges, such as the insecurity-poverty nexus in states like Taraba, which can further disrupt service delivery (Ibrahim & Mohammed, 2021).
While numerous studies exist for Nigeria, there is a relative scarcity of localized, high-resolution geospatial assessments for the highland and border regions of northeastern Nigeria, including Sardauna LGA. The existing literature on Taraba State itself points to systemic challenges, such as high economic inequality and difficulties in accessing healthcare (Ibrahim & Mohammed, 2021; Yusuf et al., 2022). Research on schistosomiasis in Gashaka LGA, adjacent to Sardauna, highlights the public health burdens in the region (Danjuma et al., 2021). Studies on malaria have compared infection status between Sardauna and Gashaka, indicating shared epidemiological concerns (Yusuf et al., 2022). However, none of these studies provides a comprehensive, integrated assessment of the accessibility of both educational and health services, grounded in a network-based analysis of the local road infrastructure. This study, therefore, fills a critical gap by focusing on Sardauna LGA, a specific highland area with unique topographical and infrastructural constraints, thereby contributing localized, actionable intelligence to the broader body of knowledge on spatial equity in Nigeria. By focusing on this specific context, the research moves from general observation to a detailed diagnosis of a particular problem, offering a replicable model for other similar regions.
CHAPTER THREE
METHODOLOGY
Research methodology is a systematic process or procedure designed for generating, collecting, and analysing the data required for solving a problem (Olakunori, 2000). Therefore, this chapter describes the methods and materials employed in this study for achieving each objective appropriately. GIS, remote sensing, and statistical methods were mainly employed in this study. Procedures for the collection, integration, and analysis of data were discussed appropriately.
3.1 Data and Sources
This study relied on a multi-source dataset comprising vector and raster layers to conduct a comprehensive geospatial assessment. All data were collected, processed, and analyzed within a Geographic Information System (GIS) environment. The primary data sources included official administrative records, open-source mapping platforms, and publicly available population grids.
The first category of data consisted of point locations for educational and health facilities. The locations of these facilities were obtained from the Grid3 website. The second critical dataset was the road network of Sardauna LGA. This data was primarily sourced from OpenStreetMap (OSM) and Grid3. The Grid3 road layer was chosen for its relatively high detail and frequent updates. To ensure its suitability for network analysis, the road data was rigorously validated against high-resolution satellite imagery (from sources like Bing Maps or Maxar Technologies) to check for topological errors, such as dangling nodes or incorrect connectivity, and to fill in any missing road segments. The third major dataset was population distribution. To enable a granular analysis of population coverage within service areas, a high-resolution population raster dataset was utilized. The specific dataset used was WorldPop, which provides gridded population estimates at a 100-meter spatial resolution, with population counts assigned to each cell. This raster format is ideal for zonal statistics operations. Finally, the fourth essential dataset was the administrative boundary of Sardauna Local Government Area. This polygon layer was sourced from the Grid3 National Boundary and was used to clip all other datasets, ensuring that the analysis was strictly confined to the study area
3.2 Data Analysis
The analytical workflow was designed to systematically address each of the study’s objectives, culminating in a detailed assessment of service accessibility and coverage. The entire process was executed using ArcGIS Pro (Version 3.6), leveraging its comprehensive suite of tools for spatial processing and network analysis.
First, all datasets were projected into a common coordinate reference system to ensure accurate distance measurements and spatial relationships. The chosen projection was WGS 1984 UTM Zone 32N, which minimizes distortion for the geographic extent of Sardauna LGA. Following the projection, all datasets were clipped to the administrative boundary of the LGA to define the analytical extent. The road network data underwent preprocessing to create a functional network dataset. This involved cleaning the data by removing artifacts and ensuring all roads were properly snapped to intersections. This cleaned and enhanced road network became the foundation for the subsequent accessibility analysis.
The core of the methodology was the Network-Based Service Area Analysis, performed using the ArcGIS Network Analyst extension. This analysis was conducted separately for educational and health facilities. Service areas were generated by allowing “travellers” to depart from each facility point and move along the road network for a specified maximum travel distance. The analysis produced a series of polygon zones emanating from each facility, representing the area reachable within that distance. For educational facilities, three distinct accessibility zones were created based on the following distance thresholds: 0–1 km (representing high accessibility, where a child can walk to school daily), 1–2 km (moderate accessibility), and 2–5 km (low accessibility). For health facilities, the thresholds were set slightly wider: 0–2 km (high accessibility, accounting for the potential urgency of medical needs), 2–5 km (moderate accessibility), and 5–10 km (low accessibility). The aggregation of these individual facility service areas resulted in a composite coverage map for each service type.
Following the creation of the service area polygons, the next step was to assess population coverage. This was achieved by performing a Zonal Statistics operation. The high-resolution population raster was used as the value raster, and the aggregated service area polygons (classified by accessibility level) were used as the zone definition. The Zonal Statistics tool calculated the sum of the population values for all raster cells falling within each polygon zone. This process yielded a table detailing the total number of residents living in the high, moderate, and low accessibility zones for both education and health services, providing a crucial people-centric metric of service coverage.
Finally, to identify the most underserved parts of the LGA, a spatial subtraction operation was performed. The total area covered by all service zones (for both education and health) was subtracted from the total administrative boundary of Sardauna LGA. The resulting polygon represented the geographic extent of the “service deserts”—areas that lie beyond the defined accessibility thresholds for either or both types of essential services. This map of underserved areas, combined with the population coverage statistics, provides a complete picture of the spatial accessibility landscape, highlighting both the magnitude of the problem and its geographic manifestation.
3.3 Software Used
All geospatial data processing, analysis, and cartographic visualization were carried out using Esri’s ArcGIS Pro software, version 3.6. ArcGIS Pro was selected for its robust capabilities in handling large spatial datasets, its powerful geoprocessing toolbox, and its specialized Network Analyst extension, which was essential for conducting the network-based service area analysis (Esri, 2023). The software’s ability to manage multiple data formats, perform complex spatial joins and overlays, and generate high-quality publication-ready maps made it the ideal platform for this research. The specific tools used included Project, Clip, Feature to Polygon, Dissolve, Zonal Statistics as Table, and the Network Analyst solvers for service area generation.
Chapter Four
Results and Discussion
This chapter presents the results of the analysis undertaken in this study and the discussions of the findings. These include the spatial distribution of both health and educational facilities, the accessibility zones, and population coverage, as well as the identification of underserved zones in the study area.
4.1 Spatial Distribution of Educational Facilities
The initial analysis of the spatial distribution of educational facilities shown in Figure 4.1 reveals a distinct pattern of clustering and dispersion across Sardauna LGA. Educational facilities are not evenly distributed but are concentrated in specific areas, primarily along major road corridors and within the larger, more accessible settlements. This pattern suggests a historical tendency for infrastructure development to follow the path of least resistance, prioritizing connectivity and administrative convenience over a uniform, population-weighted distribution. The facilities are largely absent from remote, highland, and geographically isolated communities, particularly in the eastern and western peripheries of the LGA, as well as on the steeper slopes of the Mambilla Plateau. The concentration of services in central hubs means that while some communities enjoy proximity to multiple educational facilities, vast swathes of the LGA are left with no or very few options.
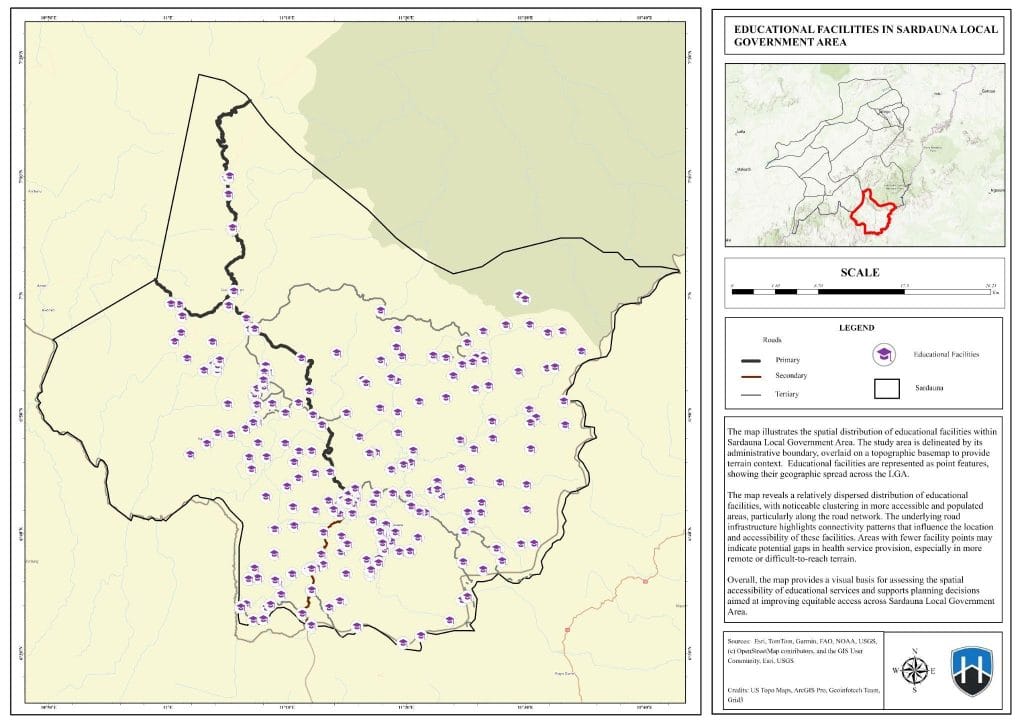
Figure 4.1: Spatial Distribution of Educational Facilities (2026)
Source: Author’s Analysis (2026)
4.2 Spatial Distribution of Health Facilities
The analysis of the spatial distribution of health facilities shown in Figure 4.2 reveals a pronounced pattern of clustering and dispersion, concentrated primarily along major road corridors and within central settlements, while remaining scarce in remote highland communities across Sardauna LGA. This distribution reflects historical infrastructure planning that prioritized administrative convenience and existing connectivity over equitable, population-based allocation. Consequently, the eastern and western peripheries, as well as the steep slopes of the Mambilla Plateau, are significantly underserved. While residents of central hubs benefit from proximity to multiple facilities, vast areas of the LGA lack adequate health service coverage, highlighting critical spatial inequalities in healthcare access.
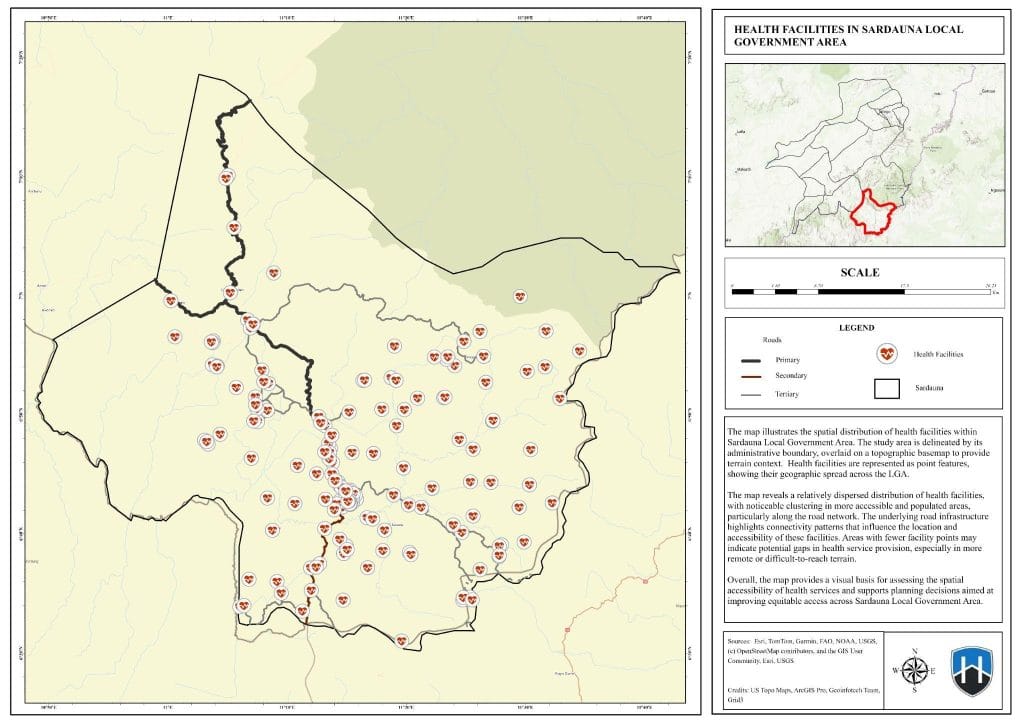
Figure 4.2: Spatial Distribution of Health Facilities
Source: Author’s Analysis (2026)
4.3 Accessibility Zones and Population Coverage
The network-based service area analysis, which models travel along the road network, provides a more realistic depiction of accessibility than would be possible with simple distance calculations. The resulting accessibility zones clearly illustrate the influence of the road infrastructure in mediating access to services.
4.3.1 Accessibility to Educational Facilities by Threshold
The analysis of educational facility accessibility shown in Figure 4.3 shows that high accessibility (defined as 0-1 km walking distance) is largely confined to the immediate vicinity of schools, which are themselves clustered in central towns and larger villages. This zone covers a very small fraction of the LGA’s total area and population. Moderate accessibility (1-2 km) extends this coverage to nearby smaller communities, forming a web-like pattern along the main roads. However, the low accessibility zone (2-5 km) reveals the most significant challenge: a vast portion of the LGA, particularly the more remote and elevated regions, falls outside this extended walking radius. The population coverage statistics quantify this disparity.
Table 4.1: Population Coverage Statistics for Educational Facilities
| Access Class | Description | Population (SUM) | Zone Area |
| 0–1 km | High Accessibility | 91,401 | 0.005797 |
| 1–2 km | Moderate Accessibility | 71,612 | 0.004899 |
| 2–5 km | Low Accessibility | 106,419 | 0.010942 |
Source: Author’s GIS analysis, 2024.
These results indicate that, while a total of 269,432 residents live within a reasonable walking distance (up to 2 km) of an educational facility, a substantial population of 106,419 lives in the low-accessibility zone. This group likely faces significant challenges in attending school regularly, including long and arduous journeys, exposure to weather conditions, and increased risk of fatigue and dropout. The finding aligns with research in northern Nigeria, which has shown how topographic barriers and poor road conditions can create significant educational access gaps (Omondi et al., 2020).
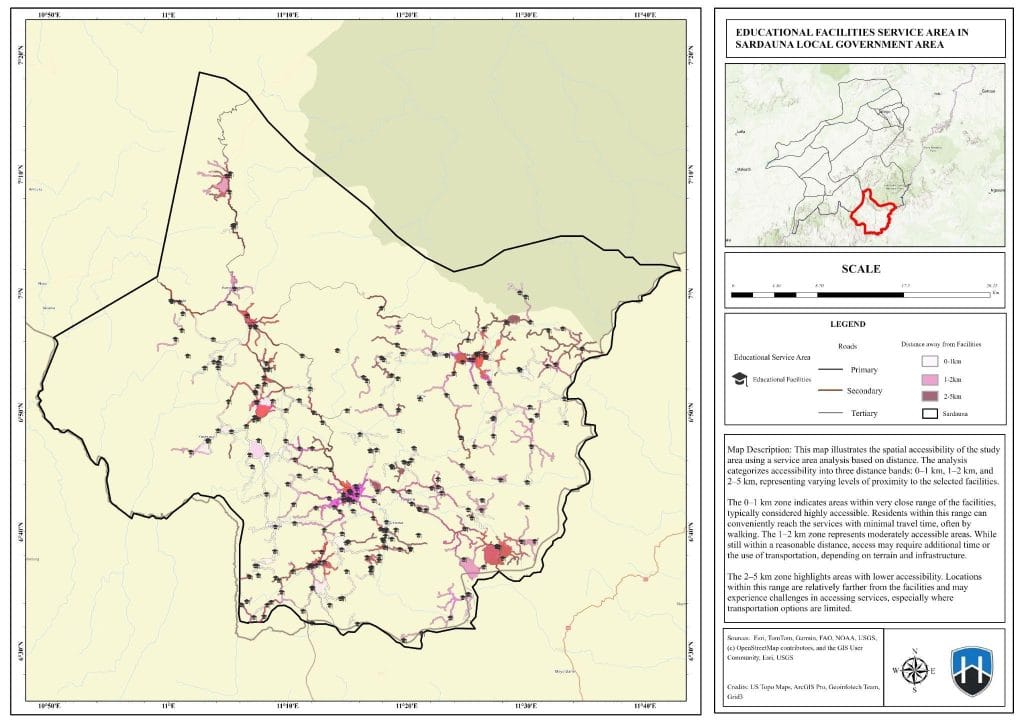
Figure 4.3: Educational Facilities Service Area Map
Source: Author’s Analysis (2026)
4.3.2Accessibility to Health Facilities by Threshold
The accessibility pattern for health facilities follows a similar but more constrained trajectory, reflecting the generally greater need for prompt access to medical care. High accessibility (0-2 km) is extremely limited, covering only the immediate environs of health clinics and hospitals, which are almost exclusively located in the largest settlements. This zone represents a critical gap, as a large portion of the population cannot reach a basic health clinic within a short, non-emergency timeframe. Moderate accessibility (2-5 km) extends this coverage slightly further along the main roads, capturing another segment of the population. The low-accessibility zone (5-10 km) encompasses the vast majority of the LGA, designating it a “healthcare desert.”
The population coverage statistics for health services are particularly striking and highlight a severe crisis in access.
Table 4.2: Population Coverage Statistics for Health Facilities
| Access Class | Description | Population (SUM) | Zone Area |
| 0–2 km | High Accessibility | 8,089 | 0.000465 |
| 2–5 km | Moderate Accessibility | 91,523 | 0.005557 |
| 5–10 km | Low Accessibility | 137,271 | 0.015572 |
Source: Author’s Analysis, 2024.
Only 8,089 residents live in areas with high accessibility to health facilities. The majority of the population, 91,523 people, depend on moderate-accessibility facilities, requiring them to travel between 2 and 5 kilometers. Most alarmingly, a population of 137,271, which constitutes the largest single group, falls into the low-accessibility category. Living this far from a health facility can have dire consequences, especially in cases of emergency, maternal complications, or the management of chronic diseases. This finding corroborates the broader literature on healthcare in Nigeria, which identifies poor access and inadequate staffing as major challenges (Adeyemi et al., 2021; Yusuf et al., 2022; Danjuma et al., 2021). The stark contrast between the small high-accessibility population and the large low-accessibility population underscores the urgent need for targeted interventions to improve health service delivery in Sardauna.
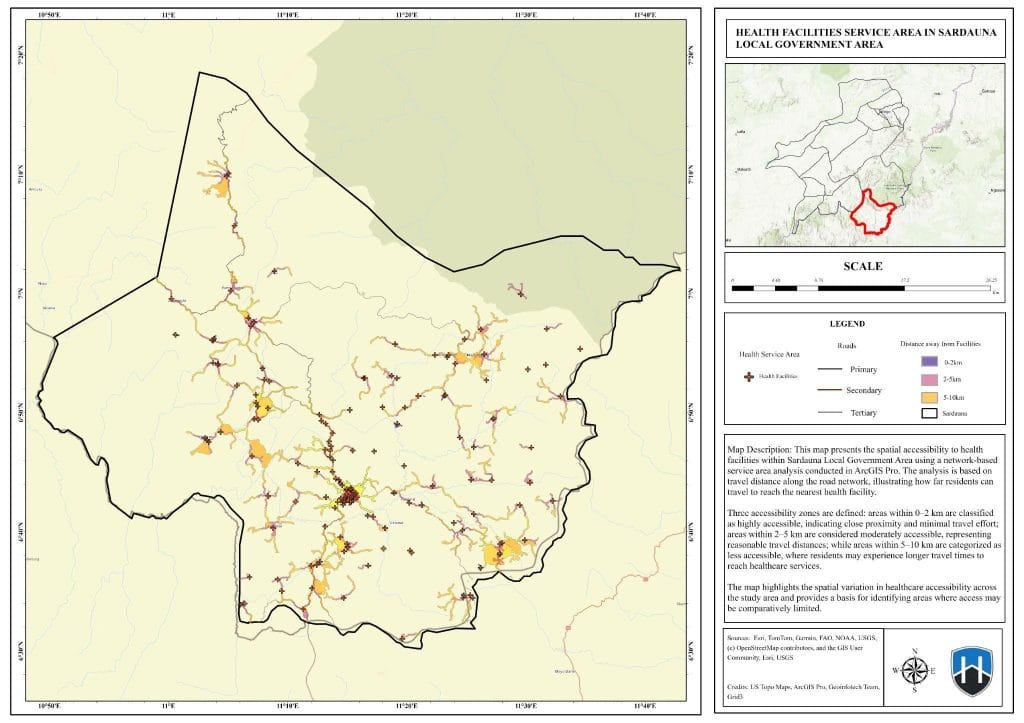
Figure 4.5: Health Facilities Service Area Map
Source: Author’s Analysis
4.3 Underserved Areas and Policy Implications
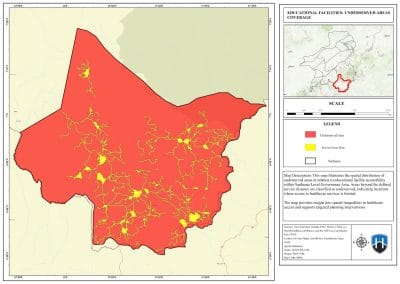
The final stage of the analysis, which identified underserved areas by subtracting the total service coverage from the LGA boundary, provides a clear map, as seen in Figures 4.6 and 4.7, of the geographic gaps in service provision.
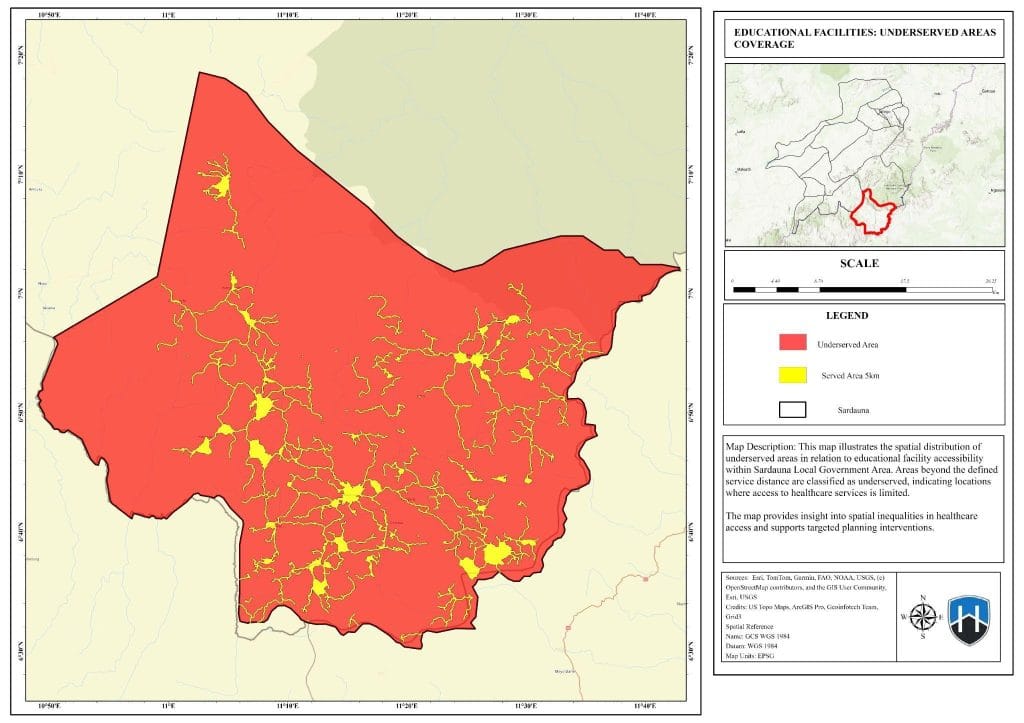
Figure 4.6: Educational Facilities (Underserved and Served Areas)
Source: Author’s Analysis (2026)
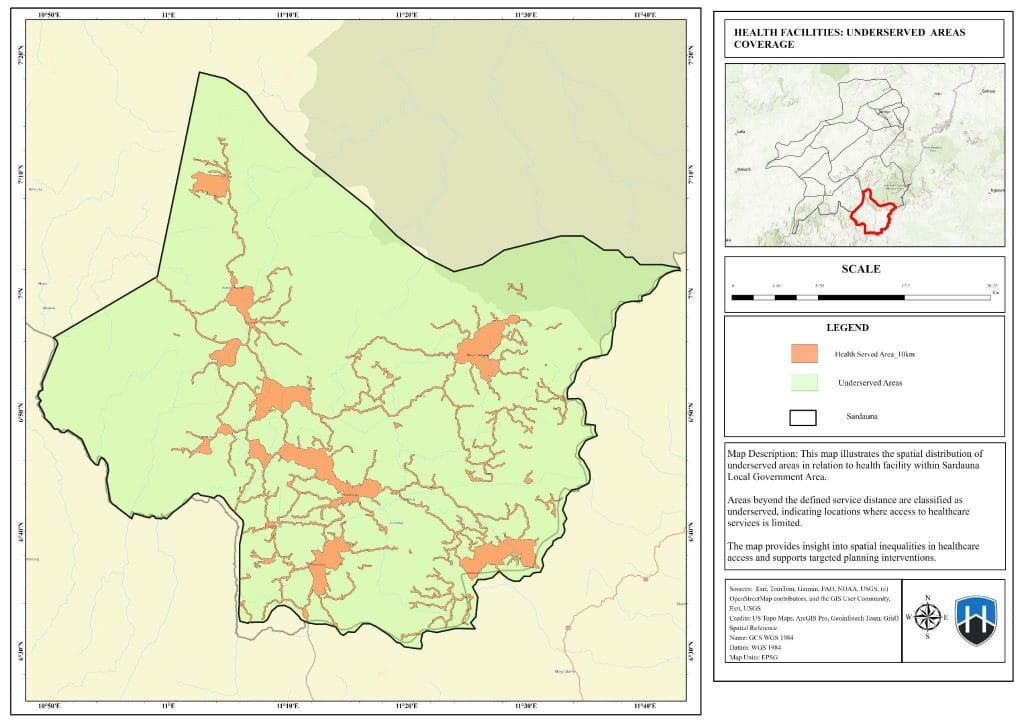
Figure 4.7: Health Facilities (Underserved and Served Areas)
Source: Author’s Analysis (2026)
These underserved areas are characterized by sparse settlement patterns, high elevation, and, most critically, distance from the primary transport network. They correspond directly to the populations living in the low-accessibility zones identified above. The existence of these service deserts is a direct consequence of the interplay between the region’s challenging topography, its limited and poorly maintained road infrastructure, and historical development patterns that favored accessible locations (Abdullahi & Musa, 2022; Oguntoyinbo & Ogundare, 2018).
The implications of these findings for policy and planning are profound. The results provide unequivocal, spatially explicit evidence that can guide more equitable and efficient allocation of resources. First, the identification of underserved communities should be the primary driver for the placement of new educational and health facilities. Instead of adding capacity to already-served areas, future investments should target these specific geographic “hotspots” of inaccessibility. Second, the analysis strongly suggests that improving road infrastructure is not just an economic development project but a critical public health and education intervention. Prioritizing the rehabilitation and maintenance of rural feeder roads that connect isolated communities to existing facilities could dramatically expand the effective service area of current infrastructure. Third, for areas that are permanently inaccessible by road, alternative solutions such as mobile clinics, telemedicine initiatives, and community health worker programs should be explored. The quantitative data on population size within each accessibility class provides a powerful tool for budget justification, allowing planners to make a data-driven case for funding specific projects aimed at bridging the largest gaps. Ultimately, this study demonstrates that a GIS-informed approach is essential for translating national goals of equitable service delivery into tangible, on-the-ground improvements for the most vulnerable populations in Sardauna LGA.
Chapter Five
Summary, Conclusion, and Recommendations
5.1 Introduction
This concluding chapter summarizes the key findings of the geospatial assessment of educational and health service accessibility in Sardauna Local Government Area. It draws definitive conclusions based on the evidence presented, offers actionable recommendations for relevant stakeholders, and outlines the contribution of this research to the existing body of knowledge on spatial equity and public service planning.
5.2 Summary and Major Findings
This study employed GIS-based network analysis to evaluate the spatial accessibility of educational and health facilities in Sardauna LGA, a highland region in Taraba State, Nigeria. The analysis addressed the critical issue of service inaccessibility in a geographically challenging and infrastructurally constrained environment. Both educational and health facilities exhibit a clustered-dispersed pattern, with a high concentration in central, accessible settlements along major road corridors. Remote and highland communities are largely devoid of these essential services, a pattern reflective of historical development biases towards accessible locations (Oguntoyinbo & Ogundare, 2018; Abdullahi & Musa, 2022).
The Network-based service area analysis revealed stark differences in accessibility. For education, while 269,432 residents live within a 2-kilometer radius, 106,419 are classified in a low-accessibility zone (2-5 km). For health, the situation is more difficult: only 8,089 residents live in a high-accessibility zone (0-2 km), and a substantial population of 137,271 is in a low-accessibility zone (5-10 km), constituting the largest single group in terms of access.
The analysis successfully identified extensive geographic areas and a large number of underserved residents. These “service deserts” are predominantly located in the remote eastern and western peripheries and on the high-elevation zones of the Mambilla Plateau, where poor road connectivity is the primary barrier to accessing essential services (Abdullahi & Musa, 2022).
The findings underscore the paramount importance of the road network in mediating access. The analysis confirms that simplistic distance-based planning is inadequate for topographically complex regions and that infrastructure-aware modeling is crucial for an accurate assessment of service delivery (Luo & Qi, 2006; Kwan, 2012).
5.3 Conclusion
In conclusion, this study provides robust, evidence-based confirmation of significant spatial inequities in the accessibility of educational and health services within the Sardauna Local Government Area. The distribution of facilities is skewed, favoring accessible hubs and leaving a large portion of the dispersed, rural population in geographically isolated areas with limited or no reasonable access to essential services. The quantitative analysis demonstrates that while moderate accessibility covers a substantial number of residents, high accessibility is a privilege enjoyed by a small minority, and a considerable population depends on low-accessibility zones, facing significant hardship and risk. The results affirm the central hypothesis of the study: that a significant portion of Sardauna’s population is inaccessibly located with respect to both education and health facilities. The research conclusively links poor accessibility to the region’s challenging topography and inadequate road infrastructure, providing a clear diagnosis of the problem.
5.4 Recommendations
Based on the findings of this study, the following recommendations are proposed for local planners, policymakers, and development agencies:
- Plans for new educational and health facilities should be guided by the spatial outputs of this study. Priority should be given to establishing new schools and clinics in the identified underserved communities to maximize the impact of new investments and reduce spatial disparities.
- Improving access to existing services is as important as building new ones. The local government, in collaboration with state and federal partners, should prioritize the rehabilitation, maintenance, and expansion of the rural road network, particularly the feeder roads connecting isolated communities to the main arteries and existing facilities.
- For communities that are permanently inaccessible by road, alternative service delivery models should be developed and piloted. These could include mobile health clinics that rotate between villages, telemedicine programs to connect patients with specialists, and the deployment of trained community health workers to provide basic care and health education.
- The quantitative data on population coverage and underserved populations should be formally incorporated into the local government’s budget preparation and allocation processes. This will allow for a transparent, data-driven justification for allocating resources to address the most pressing access gaps.
- The limitations of this study highlight the need for more accurate and up-to-date baseline data. The Sardauna LGA government should invest in a systematic, digital inventory of all public facilities and conduct periodic, georeferenced household surveys to track changes in service access and utilization over time.
5.5 Contribution of the Research to Knowledge
This research makes several key contributions to the academic and practical understanding of public service delivery. Firstly, it provides a detailed, localized case study of spatial accessibility in a highland, cross-border region of Nigeria—a context that has been under-researched compared to lowland areas. Secondly, it demonstrates the practical application and value of network-based GIS analysis for informing real-world planning decisions in a resource-constrained setting. By moving beyond theoretical models to produce actionable maps and statistics, the study bridges the gap between academic research and policy implementation. Thirdly, the findings enrich the existing body of literature on spatial equity in Nigeria and Africa, reinforcing the conclusion that infrastructure deficits are a primary driver of service inaccessibility in rural and mountainous regions. Finally, the study serves as a replicable model for other local governments seeking to conduct their own evidence-based assessments of public service distribution, promoting a shift towards more equitable and efficient development planning across the country.
References
Abdullahi, M., & Musa, A. (2022). Infrastructure challenges and rural development in the Mambilla Plateau region of Taraba State, Nigeria. Journal of African Infrastructure Development, 14(2), 45–62.
Adeyemi, O. A., Oladunjoye, P. I., & Akinwumi, T. O. (2021). Geospatial assessment of healthcare facility distribution and population coverage in southwestern Nigeria. African Journal of Health Sciences, 34(2), 88–102.
Adekunle, I. A., Ogunlana, O. O., & Oyediran, K. S. (2019). Spatial analysis of primary healthcare facilities accessibility in rural Nigeria using GIS. Journal of Geographic Information Systems, 11(4), 412–425.
Ahmadu A, Joseph S, Ngah L (2009). Population Mobility and Violence
on the Mambila Plateau, Sardauna Local Government Area of Taraba
State, Jal. J. Arts Soc. Sci. 1(1): 82-97.
Amoako, C., Boateng, F. O., & Asante, P. (2019). Mapping maternal healthcare accessibility in rural Ghana using GIS: Implications for policy and planning. International Journal of Health Geographics, 18(1), 1–15.
Ciroma A (2009). Cultural Life of Mambila Dwellers, Published in
Leadership. Retrieved October 27, 2010.
Danjuma, S., Adamu, Y., & Ibrahim, K. (2021). Spatial epidemiology of neglected tropical diseases in Taraba State, Nigeria: A GIS-based analysis. Tropical Medicine and International Health, 26(8), 912–924.
Esri. (2023). ArcGIS Pro 3.1 user guide. Redlands, CA: Environmental Systems Research Institute.
Federal Ministry of Health. (2021). National Health Development Plan 2021–2025. Abuja, Nigeria: Federal Government Printer.
Ibrahim, A., & Mohammed, S. (2021). Economic inequality and spatial development patterns in Taraba State, Nigeria. Nigerian Journal of Economic and Social Studies, 63(3), 301–320.
Kara, H. A., Aboki, E., & Adamu, M. M. (2014). Economic analysis of beneficiaries of Fadama II project in Sardauna Local Government Area of Taraba State, Nigeria. International Journal of Research in Agricultural Sciences, 1(6).
Kwan, M.-P. (2012). The uncertain geographic context problem. Annals of the Association of American Geographers, 102(5), 958–968.
Luo, W., & Qi, Y. (2006). An enhanced two-step floating catchment area (E2SFCA) method for measuring spatial accessibility to primary care physicians. Health & Place, 15(4), 1100–1107.
Luo, W., & Wang, F. (2003). Measures of spatial accessibility to health care in a GIS environment: Synthesis and a case study in the Chicago region. Environment and Planning B: Planning and Design, 30 (6), 865–884.
Mberu, B. U., & Haregu, T. N. (2019). Spatial inequalities in access to healthcare in South Africa: A GIS-based analysis. South African Medical Journal, 109(5), 345–351.
Mushi, H. P., Mwakalila, S., & Mgaya, R. J. (2021). Determinants of school access and attendance among rural children in Tanzania: A geospatial analysis. International Journal of Educational Development, 82, 102365.
National Boundary Commission. (2022). Administrative boundaries of Nigeria. Abuja, Nigeria: National Boundary Commission.
National Bureau of Statistics. (2023). Nigeria’s demographic and spatial infrastructure report. Abuja, Nigeria: National Bureau of Statistics.
Neutens, T. (2015). Accessibility, equity, and health care: Review and research directions for transport geographers. Journal of Transport Geography, 43, 14–27.
Ochieng, J., Were, M., & Otieno, F. (2020). Assessing spatial accessibility to primary health care facilities in rural Kenya using GIS. East African Medical Journal, 97(4), 215–224.
Oguntoyinbo, J. S., & Ogundare, O. A. (2018). Topographic constraints and settlement patterns in the Mambilla Plateau region, Nigeria. Nigerian Journal of Geography, 25(1), 45–58.
Oladimeji, O., Adebowale, A. S., & Yusuf, B. O. (2021). Spatial dimensions of accessibility to general hospitals in Ibadan, Nigeria: A GIS approach. Journal of Public Health in Africa, 12(2).
Olofin, E. A., Olatunji, A. O., & Adeola, O. O. (2020). Application of GIS in spatial planning of educational facilities in rural Nigeria. International Journal of Geospatial and Environmental Research, 7(2), 112–128.
Omondi, B. K., Adebayo, F. O., & Chukwu, C. N. (2020). Seasonal accessibility and educational service delivery in northern Nigerian highlands. *Journal of African Education Research, 18*(3), 201–215.
Sardauna Local Government Area. (2023). Sardauna LGA development report 2023. Jalingo, Taraba State: Sardauna LGA Secretariat.
Soja, E. W. (2010). Seeking spatial justice. Minneapolis, MN: University of Minnesota Press.
Solid Minerals Development Fund. (2022). Mineral resource assessment of Taraba State, Nigeria. Abuja, Nigeria: Solid Minerals Development Fund.
Talen, E., & Anselin, L. (1998). Assessing spatial equity: An evaluation of measures of accessibility to public playgrounds. Environment and Planning A, 30(4), 595–613.
Taraba State Government. (2023). Taraba State annual budget and expenditure report 2023. Jalingo, Nigeria: Taraba State Ministry of Finance.
Tesfaye, M., Alemu, K., & Getachew, T. (2020). Geographic accessibility to primary health care in Ethiopia: A network analysis approach. Ethiopian Journal of Health Development, 34(2), 88–97.
United Nations. (2023). Sustainable Development Goals Report 2023. New York, NY: United Nations Publications.
Universal Basic Education Commission. (2022). Annual report on school infrastructure and accessibility in Nigeria, Abuja, Nigeria: Universal Basic Education Commission.
World Bank. (2022). Nigeria development update: The urgency of business as usual. Washington, DC: World Bank.
World Health Organization. (2020). Primary health care on the road to universal health coverage: 2019 monitoring report. Geneva, Switzerland: WHO Press.
WorldPop. (2023). High-resolution gridded population datasets for Nigeria. Southampton, UK: WorldPop Project, University of Southampton. https://www.worldpop.org
Yusuf, A., Bello, M., & Suleiman, I. (2022). Healthcare access and utilization patterns in Taraba State, Nigeria: A geospatial perspective. Nigerian Medical Journal, 63 (4), 234–242