Satellite imagery provides valuable insights into changes on Earth’s surface over time. With Google Earth Engine (GEE), users can efficiently analyze time-series data to monitor land cover changes, vegetation dynamics, climate trends, and urban expansion. This blog post explores how to perform time series analysis of satellite imagery using GEE.
What is Time Series Analysis in Remote Sensing?
Time series analysis involves examining satellite imagery over a specific period to detect trends, seasonal variations, and long-term changes in the environment. Applications include:
- Monitoring vegetation health (NDVI trends)
- Tracking deforestation and reforestation
- Analyzing urban growth and land use changes
- Detecting climate-related variations (temperature, precipitation, drought patterns)
Step-by-Step Guide to Time Series Analysis in GEE
1. Load the Satellite Image Collection
To analyze time series data, start by loading an image collection such as Landsat or Sentinel-2 and filtering it by date and location.
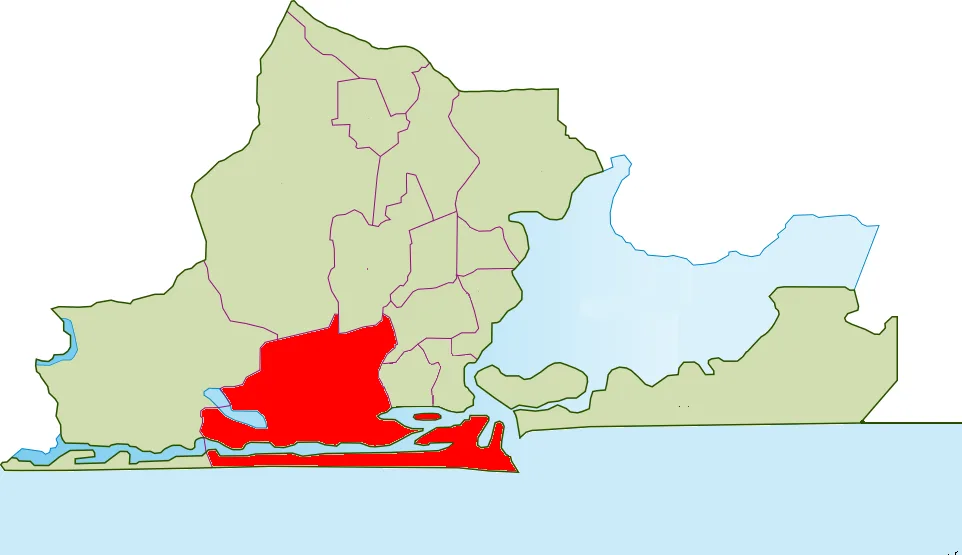
var region = ee.Geometry.Rectangle ([6.5, 3.2, 6.8, 3.5]); // Lagos, Nigeria
var dataset = ee.ImageCollection(“COPERNICUS/S2”)
.filterBounds(region)
.filterDate(“2015-01-01”, “2024-12-31”)
.filter(ee.Filter.lt(“CLOUDY_PIXEL_PERCENTAGE”, 20));
print(“Dataset Size:”, dataset.size());
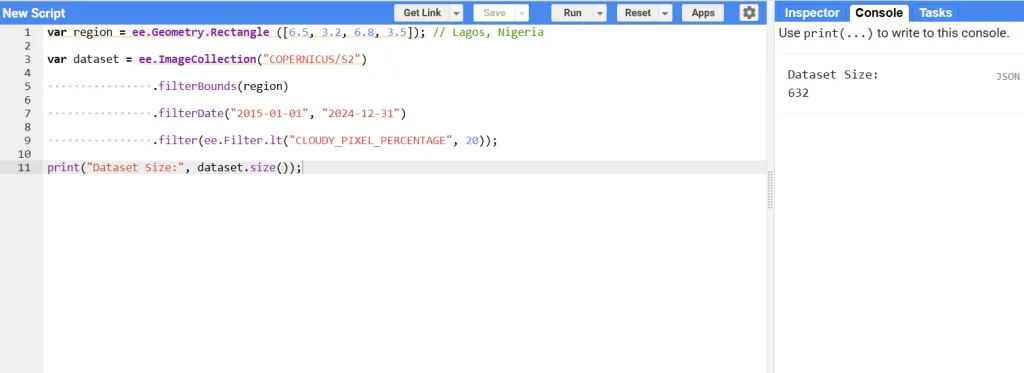
This code filters Sentinel-2 imagery for Lagos, Nigeria, from 2015 to 2024, ensuring images with less than 20% cloud cover are selected.
2. Compute NDVI Time Series
The Normalized Difference Vegetation Index (NDVI) is commonly used to analyze vegetation health over time.
var addNDVI = function(image) {
var ndvi = image.normalizedDifference([“B8”, “B4”]).rename(“NDVI”);
return image.addBands(ndvi);
};
var datasetWithNDVI = dataset.map(addNDVI);
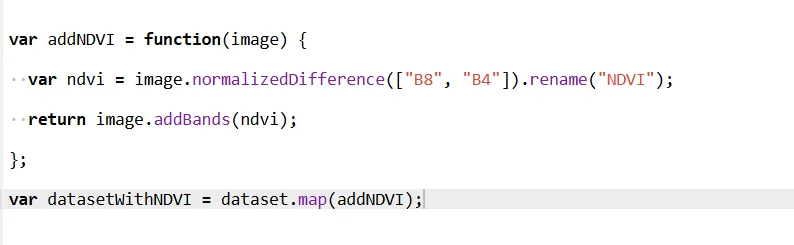
This function calculates NDVI for each image in the collection.
3. Visualizing the Time Series Data
Generate a chart of NDVI trends over time.
var chart = ui.Chart.image.series({
imageCollection: datasetWithNDVI.select(“NDVI”),
region: region,
reducer: ee.Reducer.mean(),
scale: 30,
xProperty: “system:time_start”
})
.setOptions({
title: “NDVI Time Series Analysis”,
hAxis: {title: “Time”},
vAxis: {title: “NDVI Value”, minValue: 0, maxValue: 1},
lineWidth: 2,
colors: [“green”]
});
print(chart);
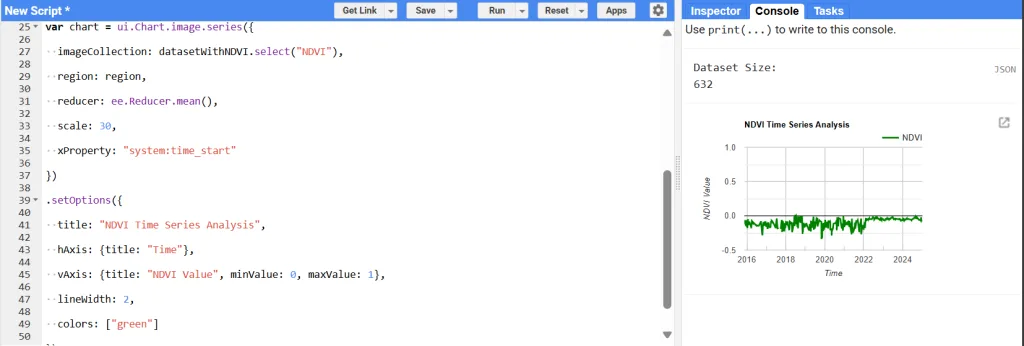
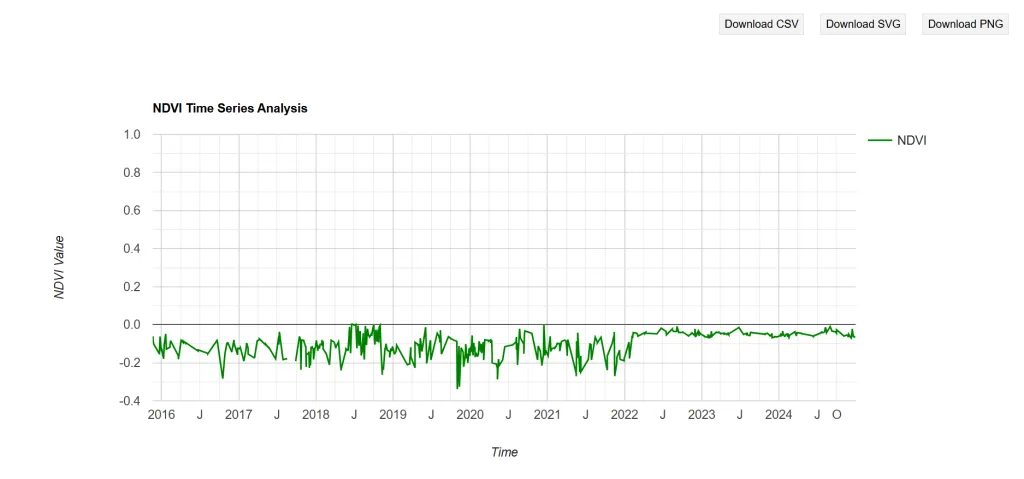
This script generates an NDVI time series chart, showing vegetation changes over time.
5. Export Time Series Data for Further Analysis
To analyze the data outside GEE (e.g., in Python, Excel, or ArcGIS Pro), export it as a CSV file.
Export.table.toDrive({
collection: ndviTimeSeries.map(function(image) {
return ee.Feature(null, {
“year”: image.get(“year”),
“month”: image.get(“month”),
“NDVI”: image.reduceRegion({
reducer: ee.Reducer.mean(),
geometry: region,
scale: 30
}).get(“NDVI”)
});
}),
description: “NDVI_TimeSeries_Lagos”,
fileFormat: “CSV”
});
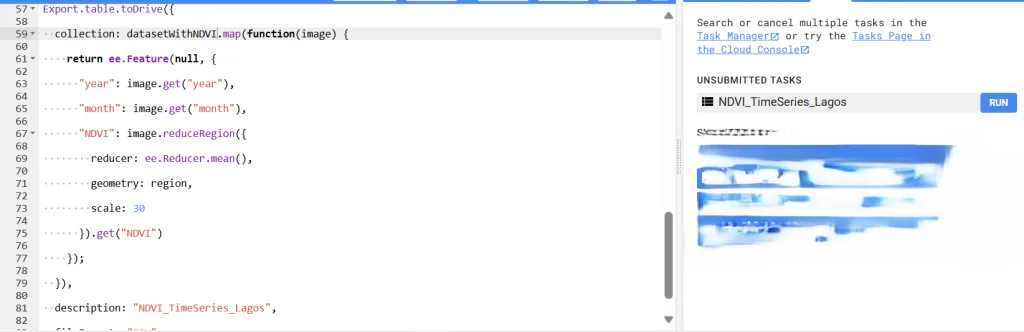
This exports NDVI values per month/year for further analysis.
Applications of Time Series Analysis in GEE
- Climate Change Monitoring – Identifying long-term trends in temperature, vegetation, and water bodies.
- Deforestation Detection – Tracking changes in forest cover using NDVI time series.
- Agricultural Analysis – Monitoring crop cycles and drought impacts.
- Urban Growth Studies – Assessing land use changes and urban expansion trends.
Conclusion
Time series analysis in Google Earth Engine enables scientists, urban planners, and environmentalists to track and analyze changes on Earth’s surface efficiently. By leveraging NDVI, statistical reductions, and visualization tools, users can gain critical insights into land cover changes, vegetation health, and climate trends.
Stay connected with GeoInfoTech for more guides on remote sensing, GIS, and Earth observation!