Vegetation indices are essential tools in remote sensing and GIS for analyzing plant health, biomass, and land cover changes. However, choosing the right vegetation index depends on the specific goals of your project, the sensor data available, and the environmental conditions. This article explores different vegetation indices, their applications, and how to select the best one for your GIS project.
Understanding Vegetation Indices
Vegetation indices are mathematical combinations of spectral bands, primarily using the Red and Near-Infrared (NIR) bands, to highlight vegetation characteristics. Some indices also incorporate Shortwave Infrared (SWIR) and Blue bands for enhanced analysis.
Common Vegetation Indices and Their Applications
Normalized Difference Vegetation Index (NDVI)
Formula: (“NIR_Band” – “Red_Band”) / (“NIR_Band” + “Red_Band”)
- Application: General vegetation health assessment, biomass estimation, and drought monitoring.
- Best for: Large-scale vegetation monitoring using Landsat, Sentinel-2, and MODIS imagery.
Enhanced Vegetation Index (EVI)
Formula: EVI=G ×(NIR-RED)/(NIR+G ×RED-C2 ×BLUE+L)
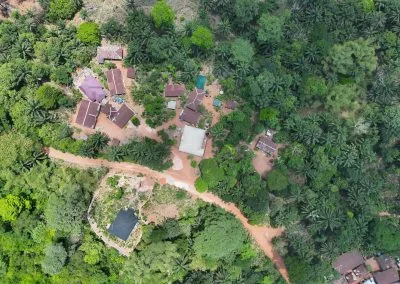
- Application: Improved vegetation monitoring in high biomass areas and correcting atmospheric distortions.
- Best for: Dense vegetation and humid regions where NDVI may saturate.
Soil-Adjusted Vegetation Index (SAVI)
Formula: SAVI=(NIR-RED)/(NIR+RED+L)(1+L)
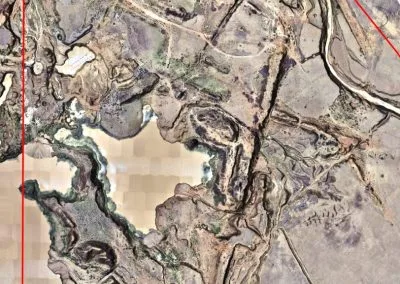
- Application: Vegetation analysis in arid and semi-arid regions where soil brightness affects NDVI.
- Best for: Sparse vegetation areas, desert environments, and drylands.
Normalized Difference Water Index (NDWI)
Formula: (NIR – SWIR)/(NIR+SWIR)
- Application: Monitoring water content in vegetation and detecting water bodies.
- Best for: Drought studies, wetland mapping, and irrigation monitoring.
Red Edge Vegetation Index (REVI)
Formula: (NIR – RedEdge) / (NIR + RedEdge)
- Application: Monitoring plant stress and early disease detection.
- Best for: Precision agriculture and hyperspectral remote sensing.
Green Normalized Difference Vegetation Index (GNDVI)
Formula: (NIR – Green) / (NIR + Green)
- Application: Detecting chlorophyll content and plant vigor.
- Best for: Precision farming, crop health analysis, and forestry applications.
How to Choose the Right Vegetation Index
Consider the following factors when selecting a vegetation index for your GIS project:
- Project Objective: Define whether you are assessing vegetation health, detecting water stress, or analyzing biomass.
- Environmental Conditions: Choose indices that account for soil brightness (SAVI) or dense vegetation (EVI).
- Sensor and Data Availability: Ensure your dataset includes the required spectral bands.
- Study Area Characteristics: For arid zones, use SAVI; for water detection, use NDWI; for agriculture, use REVI or GNDVI.
Implementing Vegetation Indices in ArcGIS Pro
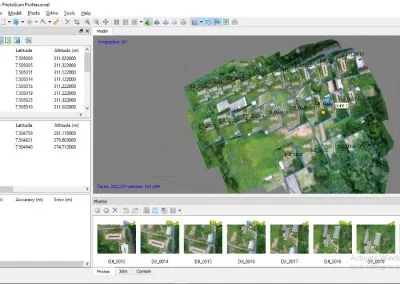
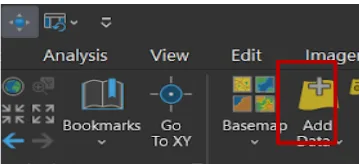
Step 1: Load the Satellite Imagery
- Import imagery from sources like Landsat, Sentinel-2, or UAV-based multispectral sensors.
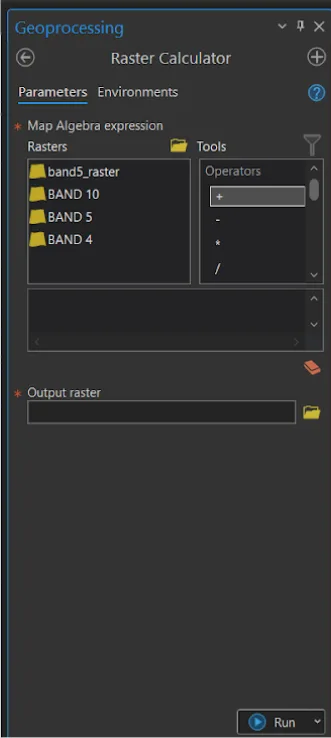
Step 2: Use the Raster Calculator
- Navigate to Analysis > Tools > Raster Calculator in ArcGIS Pro.
- Apply the formula of your chosen vegetation index using the appropriate spectral bands.
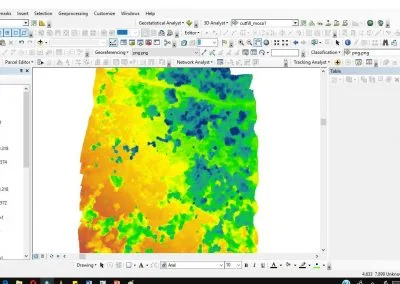
Step 3: Visualize and Analyze Results
- Apply a color ramp to enhance contrast between vegetation health levels.
- Use Zonal Statistics to extract index values for specific regions of interest.
- Choosing the right vegetation index enhances the accuracy and relevance of your GIS analysis. Whether monitoring forests, managing agriculture, or assessing drought conditions, selecting the appropriate index ensures meaningful insights. Experiment with different indices based on your study needs and available data for optimal results.