Vegetation health assessment is a crucial part of environmental monitoring, precision agriculture, and land cover classification. One of the most widely used vegetation indices in remote sensing and GIS applications is the Normalized Difference Vegetation Index (NDVI). This article explores what NDVI is, how it works, and how to calculate it using ArcGIS Pro.
What is NDVI?
NDVI is a remote sensing-derived index that measures vegetation health and biomass by analyzing the difference between near-infrared (NIR) and red (RED) reflectance values from satellite or drone imagery. Since healthy vegetation strongly reflects NIR light and absorbs RED light, NDVI helps in distinguishing between healthy and stressed vegetation.
FORMULAR = (“NIR_Band” – “Red_Band”) / (“NIR_Band” + “Red_Band”)
Where:
- NIR = Near-Infrared band value (e.g., Landsat Band 5, Sentinel-2 Band 8)
- RED = Red band value (e.g., Landsat Band 4, Sentinel-2 Band 4)
NDVI values range from -1 to +1:
- +0.6 to +1.0: Dense, healthy vegetation
- +0.2 to +0.5: Sparse or stressed vegetation
- 0 to +0.2: Bare soil or low vegetation
- Negative values: Water bodies, clouds, or non-vegetated surfaces
Applications of NDVI
NDVI has a wide range of applications, including:
- Agriculture: Monitoring crop health, yield estimation, and detecting plant stress.
- Forestry: Assessing deforestation, forest health, and biomass estimation.
- Land Cover Classification: Differentiating between vegetation, water, and urban areas.
- Drought Monitoring: Detecting drought-affected regions based on vegetation changes.
- Environmental Management: Studying ecological changes and habitat degradation.
How to Calculate NDVI in ArcGIS Pro
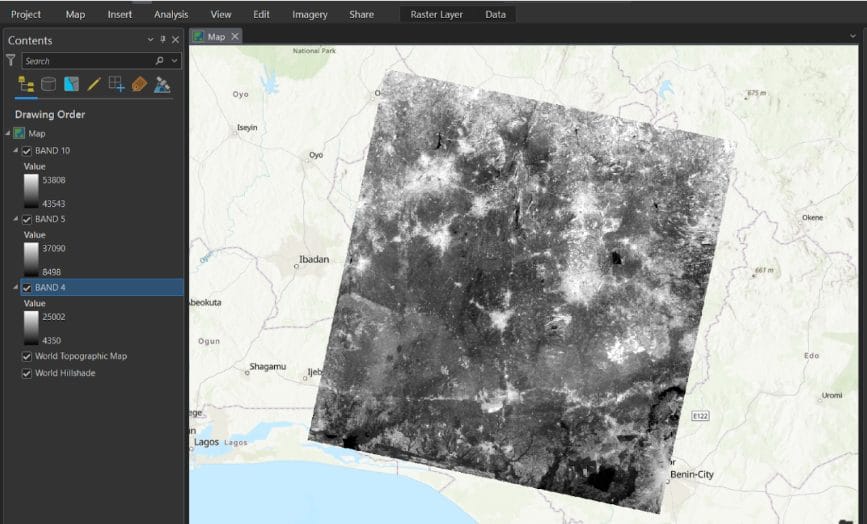
Step 1: Load Satellite Imagery
- Import multispectral satellite data (e.g., Landsat-8) into ArcGIS Pro.
- Ensure the dataset has both NIR and RED bands.
For Landsat-8
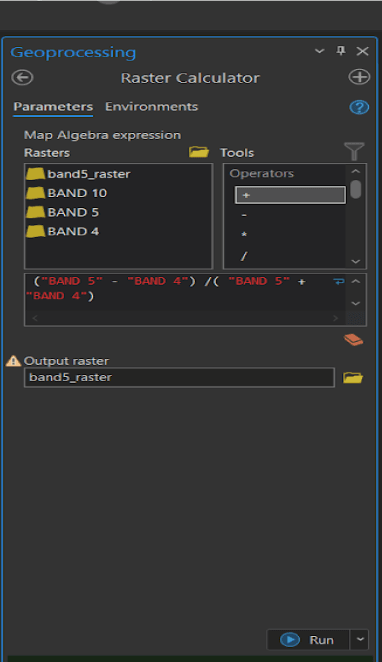
Step 2: Open the Raster Calculator
- Navigate to Analysis > Tools > Raster Calculator in ArcGIS Pro.
- Use the NDVI formula:
NDVI = (“NIR_Band” – “Red_Band”) / (“NIR_Band” + “Red_Band”)
- Replace “NIR_Band” and “Red_Band” with the respective band names from your dataset.
For Landsat-8 = (“Band 5” – “Band 4”) / (“Band 5” + “Band 4”)
Step 3: Apply Symbology for Visualization
- Open the NDVI raster layer properties and apply a color ramp (e.g., green for high NDVI, red for low NDVI).
- Adjust the classification to better visualize vegetation health.
Step 4: Export and Interpret Results
- Save the NDVI output as a raster file.
- Use the Zonal Statistics tool to extract NDVI values for specific regions.
- Compare NDVI results over time for change detection analysis.
NDVI is a powerful tool for vegetation analysis and land cover monitoring. Using ArcGIS Pro, GIS professionals can easily calculate and visualize NDVI to make informed decisions in agriculture, forestry, and environmental management. By integrating NDVI with other GIS