Navigating the downstream petroleum sector in Nigeria has always been a challenge due to one unpredictable factor: price variability. Despite PMS being a regulated commodity, the reality on the ground tells a different story. From logistics bottlenecks in Lagos to supply chain inefficiencies in the North, petrol prices fluctuate significantly across state lines.
At Geoinfotech, we recognized a massive visibility gap. Decision-makers and stakeholders have long relied on static, fragmented reports that fail to show the “where” behind the “what.” To solve this, we developed a web-based GIS dashboard designed to turn raw data into actionable spatial intelligence.
The Challenge: Why Fuel Price Transparency Matters
The current PMS distribution landscape in Nigeria faces several critical hurdles that affect both the economy and daily life:
- Inconsistent pricing across geopolitical zones and states
- Limited transparency in official price reporting
- A lack of centralized, real-time monitoring tools
- Difficulty identifying underserved or high-cost regions
- Poor access to historical data for trend analysis
For businesses and regulators, these gaps lead to inefficient supply planning and a delayed response to sudden price spikes. Without data-driven insights, enforcing regulatory compliance becomes nearly impossible.
Our Solution: A Real-Time Geospatial Intelligence Hub
We built a lightweight, high-performance web-GIS dashboard that bridges the gap between the National Bureau of Statistics (NBS) data and real-world application. Our workflow ensures that the information is not just available, but understandable.
How the Dashboard Works
The system utilizes a modern tech stack to process and visualize data seamlessly:
- Data Integration: We pull PMS price data from live cloud-based endpoints, ensuring the information remains current.
- Smart Processing: Using JavaScript-based normalization, the system automatically calculates national averages, price spreads, and zonal variations.
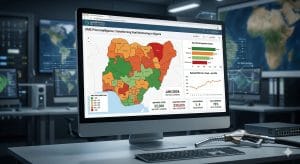
- Spatial Visualization: We use choropleth rendering (intensity mapping) to show which states are hit hardest by price hikes at a single glance.
Key Features for Data-Driven Decisions
This dashboard is more than a map; it is a comprehensive tool for the Nigerian energy sector. Users can access:
- National Metrics for 2026: View average PMS prices, minimum/maximum values, and overall data coverage.
- State-Level Profiling: High-intensity maps that visually identify the most affordable and most expensive regions.
- Comparative Analysis: A dedicated module to compare two states side-by-side or rank states by price.
- Trend Tracking: A bar chart structure ready for temporal analysis to see how prices change month-over-month.
The Operational Value of GIS in Petroleum
By moving away from static spreadsheets and embracing geospatial analytics, stakeholders gain a significant advantage. This tool supports:
- Improved Visibility: A clear view of national and regional price patterns.
- Anomaly Detection: Faster identification of outliers and price-gouging in specific regions.
- Strategic Distribution: Support for data-driven decisions regarding supply chain and logistics.
- Enhanced Transparency: Building trust across the downstream value chain.
Conclusion: Setting the Foundation for Energy Intelligence
The PMS Price Intelligence Dashboard is a practical example of how geospatial technology can solve national infrastructure challenges. By combining live data with interactive mapping, we have created a foundation for future innovations, including predictive analytics and time-series monitoring.
At Geoinfotech, we are committed to using lightweight, high-value GIS systems to deliver insights that matter.