Tracking PMS Prices in Nigeria: How Geostore’s GIS Dashboard Brings Transparency to the Petroleum Sector
Nigeria’s downstream petroleum sector continues to experience significant price variability across states. For consumers, distributors, and regulators, keeping track of these changes can be frustrating. This price volatility is largely driven by logistics constraints, supply chain inefficiencies, and regional accessibility challenges. While Premium Motor Spirit (PMS) remains a regulated commodity, actual market prices reflect disparities influenced by transportation costs, depot proximity, and distribution bottlenecks. At Geostore, we believe that geospatial data is the key to solving complex local problems. That is why we are excited to showcase a practical implementation of geospatial analytics applied to a critical national challenge: the PMS Price Intelligence Dashboard.
The Challenge: A Fragmented View of Fuel Prices
The PMS distribution landscape in Nigeria currently suffers from a massive visibility gap. Stakeholders operate without a unified system to monitor spatial price distribution, detect anomalies, or compare regional trends.The current landscape is characterized by:
- Inconsistent pricing across states and zones.
- Limited transparency in price reporting.
- An absence of centralized monitoring tools.
- Difficulty in identifying high-cost or underserved regions.
- Poor accessibility to comparative and historical insights.
From an operational standpoint, this fragmented data leads to inefficient planning for supply and distribution. It also causes delayed responses to price spikes and reduces the ability to enforce regulatory compliance. Most existing reporting methods are static, fragmented, and unsuitable for operational decision-making. A system was required that could consolidate pricing data, structure it spatially, and present it in a format suitable for analysis.
The Solution: Geostore’s Web-Based GIS Approach
To address these challenges, a lightweight web-based GIS dashboard was designed and implemented. This platform provides an interactive and structured view of PMS price distribution across Nigeria. The system integrates live data streams with spatial analytics to deliver state-level insights, comparative analysis, and actionable visualizations. Here is how the underlying architecture processes the data:
- PMS price data is sourced from a live Google Sheets CSV endpoint.
- Data is structured at the state level with periodic updates from the NBS.
- The system uses JavaScript for CSV parsing and normalization.
- It automatically computes the national average price, minimum and maximum values, price spread, and zonal averages.
Key Features of the PMS Dashboard
By combining data integration, spatial visualization, and interactive analysis, the system bridges the gap between raw pricing data and actionable insight. Users interacting with the dashboard will find:
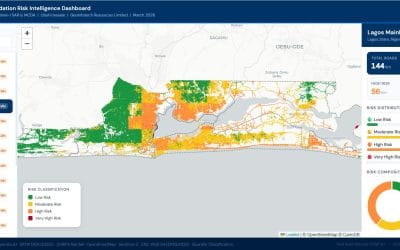
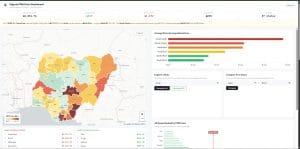
- Spatial Visualization: A state-level choropleth map showing price intensity, allowing for the visual identification of high-cost and low-cost regions.
- Up-to-Date National Metrics: Immediate access to national metrics for January 2026, including average, minimum, and maximum prices, as well as the price spread across states.
- In-Depth Comparative Analysis: Modules that display the most expensive versus most affordable states, zonal average pricing, and a tool for two-state comparisons.
- Analytical Charts: Dynamic charts for ranking and comparison, including ranked bar charts of PMS prices by state.
Driving Operational Impact Across Nigeria
From a technical standpoint, the solution demonstrates how lightweight web GIS systems can deliver high-value insights without complex infrastructure. But more importantly, the system introduces a structured approach to PMS price monitoring with clear operational benefits. The dashboard significantly improves the visibility of national and regional price patterns, enabling the faster identification of anomalies and outliers. Ultimately, it supports data-driven regulatory and distribution decisions while enhancing transparency across the downstream value chain. The current architecture also allows for future expansion into predictive analytics, time-series monitoring, and integration with broader energy sector datasets, positioning it as a foundation for more advanced decision-support systems.
Ready to explore the data?
Experience the live platform and see regional fuel trends for yourself.
Access the app here: https://geoinfotech-ng.github.io/pms-dashboard/