Spatial data is the foundation of Geographic Information Systems (GIS), helping us analyze and visualize geographic features. In GIS, spatial data is primarily categorized into Vector and Raster formats. Understanding the differences between these data types and when to use them is essential for effective GIS analysis.
What is Vector Data?
Vector data represents geographic features using points, lines, and polygons. It is structured in a way that preserves precise locations, shapes, and attributes of spatial features.
Types of Vector Data:
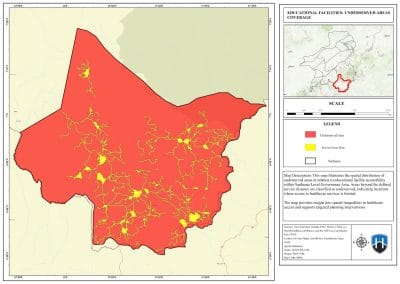
- Points – Represent specific locations (e.g., cities, landmarks, GPS coordinates
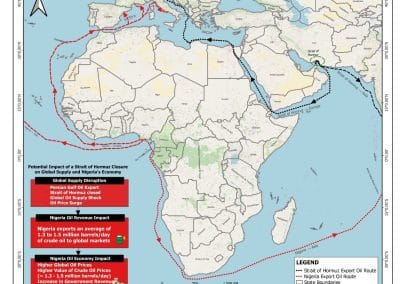
- Lines – Represent linear features (e.g., roads, rivers, pipelines)
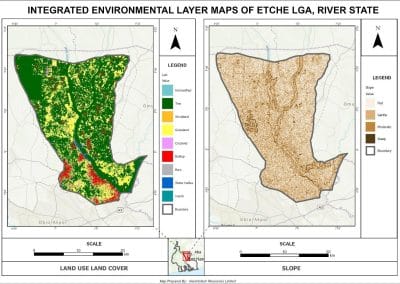
- Polygons – Represent areas (e.g., land parcels, lakes, administrative boundaries)
Example: A city map displaying roads as lines, buildings as polygons, and fire hydrants as points is built using vector data.
What is Raster Data?
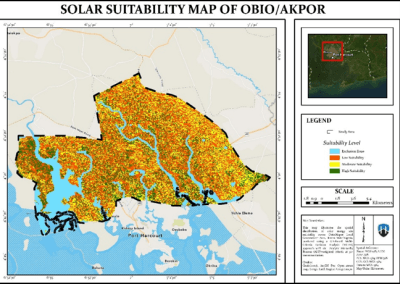
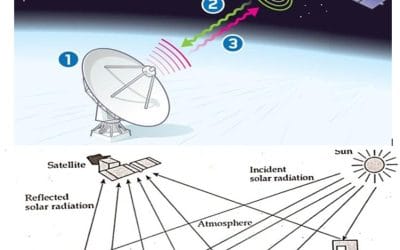
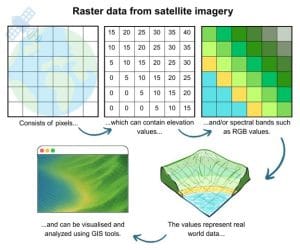
Raster data represents geographic features as grids of pixels (cells), where each cell contains a value representing a specific attribute, such as elevation, temperature, or land cover.
Characteristics of Raster Data
- Stored in a grid format (rows and columns of pixels)
- Each pixel has a spatial resolution (e.g., 10m, 30m per pixel)
- Commonly used for continuous data like elevation, satellite imagery, and weather maps
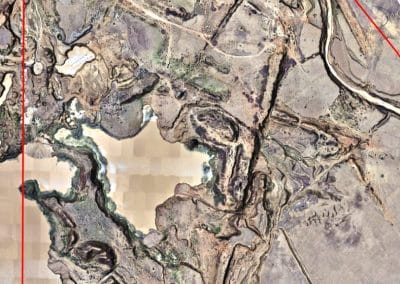
Example: A satellite image showing vegetation density or a digital elevation model (DEM) representing terrain height is an example of raster data.
Key Differences: Vector vs. Raster Data
| Feature | Vector Data | Raster Data |
|---|---|---|
| Representation | Points, lines, polygons | Grid of pixels (cells) |
| Best For | Precise locations and boundaries | Continuous phenomena and surface data |
| File Size | Smaller (stores coordinates and attributes) | Larger (depends on resolution) |
| Spatial Resolution | Infinite (based on scale) | Limited by pixel size |
| Example Uses | Roads, boundaries, infrastructure mapping | Satellite imagery, terrain models, land cover analysis |
| Common Formats | Shapefiles (.shp), GeoJSON, KML | GeoTIFF, PNG, JPEG |
When to Use Vector vs. Raster Data?
Use Vector Data When:
✔ You need precise boundaries (e.g., property lines, administrative zones)
✔ Analyzing discrete features (e.g., cities, roads, rivers)
✔ Performing network analysis (e.g., shortest route, service areas)
✔ Creating detailed maps with clean, scalable visuals
Example: A GIS professional maps electric power lines using vector data to track infrastructure and maintenance points.
Use Raster Data When
✔ Working with continuous data (e.g., elevation, temperature, precipitation)
✔ Analyzing satellite imagery and aerial photography
✔ Modeling terrain, land cover, or vegetation growth
✔ Performing raster-based calculations (e.g., NDVI for vegetation analysis, flood modeling)
Example: A climate scientist uses raster data to analyze temperature variations across a region to study climate change impacts.
🔎 Want to master spatial data analysis? Join our GIS Training Course today at GeoInfo Academy!