Agricultural suitability analysis is a crucial process in land-use planning, helping farmers, policymakers, and agricultural investors determine the most suitable locations for farming based on environmental, climatic, and soil-related factors. ArcGIS Pro provides powerful geospatial tools to analyze and visualize land suitability, improving decision-making for sustainable agriculture. This blog post explores the step-by-step process of conducting agricultural suitability analysis using ArcGIS Pro.
Key Factors in Agricultural Suitability Analysis
Agricultural suitability analysis involves evaluating various factors that influence crop productivity. These include:
- Soil Properties – Soil type, pH levels, texture, organic matter content, and drainage capacity.
- Topography – Slope, elevation, and aspect affecting soil erosion and water retention.
- Climate – Temperature, rainfall distribution, and growing season length.
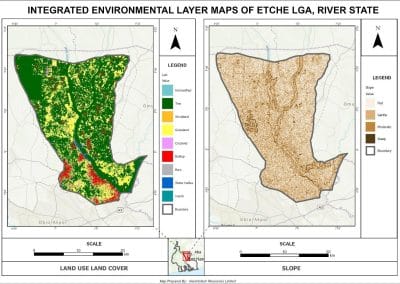
- Land Use and Land Cover – Existing vegetation, built-up areas, and conservation zones.
- Water Availability – Proximity to rivers, lakes, and groundwater sources.
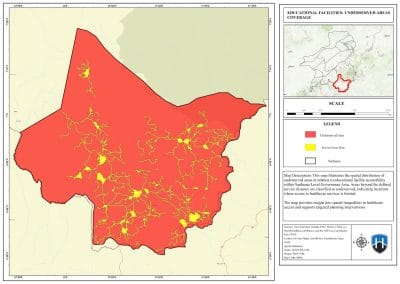
- Infrastructure and Accessibility – Distance to markets, roads, and transportation networks.
Step-by-Step Guide to Agricultural Suitability Analysis in ArcGIS Pro
Step 1: Data Collection and Preparation
- Acquire relevant datasets from sources such as:
- Soil maps (FAO, USGS, or local agencies).
- DEM (Digital Elevation Model) for topography analysis.
- Climate data (precipitation and temperature) from meteorological agencies.
- Land cover maps from satellite imagery (Landsat, Sentinel-2).
- Infrastructure datasets (roads, water bodies, settlements).
- Import the datasets into ArcGIS Pro and ensure they are in a uniform coordinate system.
Step 2: Data Processing and Standardization
To prepare your datasets for suitability analysis, it’s essential to reclassify each variable—elevation, slope, proximity to rivers, rainfall, Soil-Adjusted Vegetation Index (SAVI), and Normalized Difference Water Index (NDWI)—into standardized suitability classes. This process involves converting continuous data into categorical classes that reflect their suitability for agriculture. Here’s how to approach each variable:
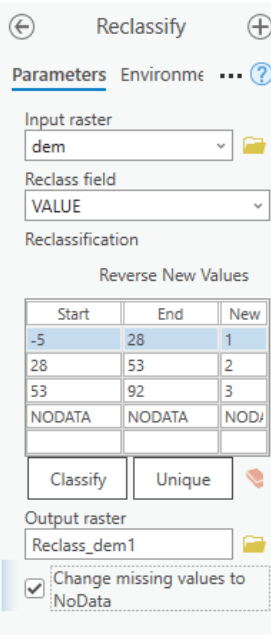
Elevation (Reclassifying DEM)
- Identify elevation ranges suitable for farming. Moderate elevations are often preferred due to better drainage and reduced flood risks.
- Use the Reclassify tool in ArcGIS Pro to assign suitability values:
- Low elevation (0–50 meters): Low suitability (value = 1)
- Moderate elevation (50–200 meters): High suitability (value = 3)
- High elevation (>200 meters): Medium suitability (value = 2)
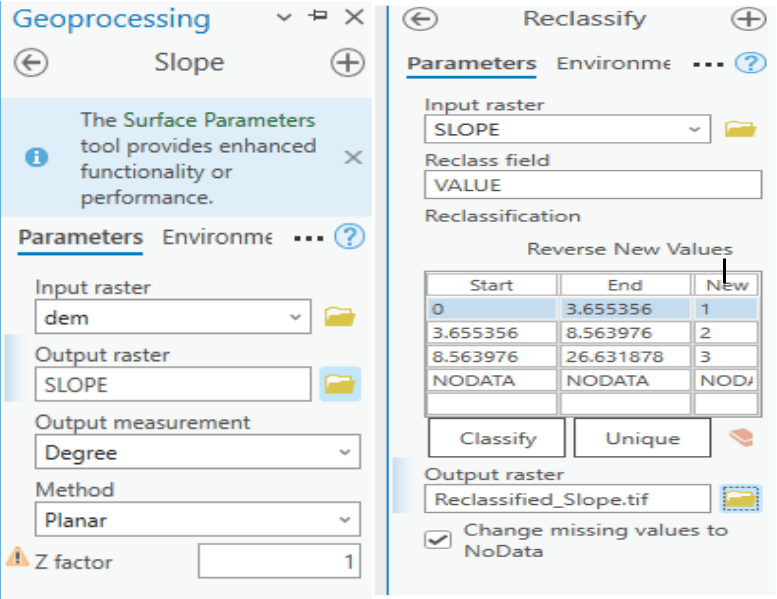
Slope using your DEM
- Gentle slopes are preferable for agriculture as they prevent soil erosion and improve water retention.
- Use the Slope tool to calculate terrain steepness and reclassify:
- 0°–5°: High suitability (value = 3)
- 5°–15°: Medium suitability (value = 2)
- 15°: Low suitability (value = 1)
Proximity to Rivers
- Areas near rivers benefit from water access but may be prone to flooding.
- Use Euclidean Distance to classify suitability:
- 0–100 meters: Low suitability (value = 1)
- 100–500 meters: High suitability (value = 3)
- 500 meters: Medium suitability (value = 2)
Rainfall
- Moderate rainfall is ideal for crop growth without increasing flood risks.
- Reclassify annual precipitation data:
- Low rainfall (<500 mm): Medium suitability (value = 2)
- Moderate rainfall (500–1000 mm): High suitability (value = 3)
- High rainfall (>1000 mm): Low suitability (value = 1)
Soil-Adjusted Vegetation Index (SAVI)= (NIR+Red+L)/(NIR−Red)×(1+L)
- SAVI measures vegetation health, indicating soil fertility and agricultural potential.
- Reclassify SAVI values:
- Low SAVI (<0.2): High suitability (value = 3)
- Moderate SAVI (0.2–0.5): Medium suitability (value = 2)
- High SAVI (>0.5): Low suitability (value = 1)
Normalized Difference Water Index (NDWI)= (NIR+SWIR)/(NIR−SWIR)
- NDWI highlights water bodies; areas with high NDWI values may indicate waterlogging issues.
- Reclassify NDWI values:
- High NDWI (>0.3): Low suitability (value = 1)
- Moderate NDWI (0.1–0.3): Medium suitability (value = 2)
- Low NDWI (<0.1): High suitability (value = 3)
By reclassifying these variables into standardized suitability classes, you create a consistent framework for integrating diverse data sources in your agricultural suitability analysis.
Step 3: Spatial Analysis and Suitability Modeling
- Use Raster Calculator: Combine weighted layers using a weighted overlay model:
Suitability = (Elevation = 0.15) + (Slope_Suitability = 0.1) + (Proximity to River = 0.15) + (Rainfall = 0.3) + (SAVI = 0.2) + (NDWI = 0.1)
- Perform Overlay Analysis: Utilize tools such as Weighted Overlay and Fuzzy Logic to refine suitability scores.
- Apply Buffer Analysis: Define buffer zones around water sources, roads, and settlements to ensure accessibility.
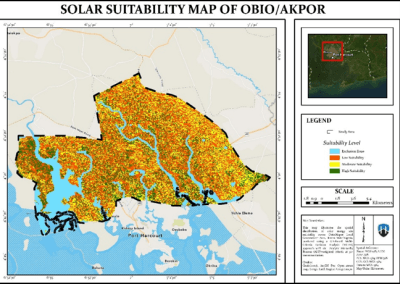
Step 4: Visualization and Interpretation
- Symbolize Results: Use color-coded classification to display suitability zones (e.g., Highly Suitable, Moderately Suitable, Unsuitable).
- Generate Reports and Maps: Create interactive maps to communicate findings effectively.
- Validate the Model: Compare results with field survey data or expert assessments.