Public health is a critical field that aims to improve the well-being of communities worldwide. Over the years, technological advancements have greatly influenced the way public health professionals approach their work. One such innovation that has revolutionized the field is Geographic Information Systems (GIS), which combines specialized software with geospatial data to provide valuable insights. In public health, GIS has proven to be an invaluable tool for disease mapping.
The Benefits of utilizing GIS in an age where global mobility and climate change accelerate the spread of disease can’t be overlooked, public health systems can’t afford to operate blindly. This is where Geographic Information Systems (GIS) become more than a mapping tool — they’re a strategic tool in disease surveillance, prevention, and emergency response. GIS offers numerous benefits for public health professionals. By leveraging GIS technology, they can visualize and analyze complex health data, facilitating evidence-based decision making.
Seeing Disease in Space and Time
Diseases don’t just happen. They emerge, cluster, and spread in patterns — shaped by geography, climate, human behavior, and infrastructure. GIS captures this complexity and translates it into actionable, location-based insight. With the right data, public health teams can visualize outbreak hotspots, monitor changes over time, and understand the spatial context that influences disease dynamics.
In 2015, health workers in Brazil used GIS to link the rising incidence of Zika virus with poor urban sanitation and areas of stagnant water — revealing correlations between infection zones and mosquito breeding grounds. This insight pushed local governments to invest in long-overdue sanitation reforms.
From Numbers to Actionable Maps
Tabular data might tell us that thousands of people are infected in a region, but GIS maps reveal where cases are concentrated, how they move, and what infrastructure is nearby. That’s the difference between knowing and understanding.
Perhaps the most globally recognized example is the COVID-19 dashboard built by Johns Hopkins University. Launched in early 2020 using ArcGIS technology, the dashboard became the go-to global reference — tracking confirmed cases, recoveries, and fatalities in real time. It helped decision-makers visualize transmission trends and coordinate lockdowns and healthcare delivery more effectively.
Predict, Don’t Just React
One of GIS’s greatest strengths lies in its predictive capacity. By analyzing historical case data alongside environmental conditions — like rainfall, temperature, elevation, or land use — health agencies can forecast future risks and plan ahead.
In Rwanda, predictive GIS modeling has helped anticipate malaria outbreaks by correlating past case clusters with seasonal weather patterns and mosquito habitats. The models supported early intervention campaigns, reducing transmission in targeted regions before the annual peak.
Targeting the Right Communities
Not every community is equally at risk, and blanket interventions often waste limited resources. GIS pinpoints vulnerable populations by integrating disease reports with data on population density, healthcare access, and socioeconomic status.
During the 2010 cholera outbreak in Haiti, GIS helped identify informal settlements lacking clean water and sanitation — allowing the Red Cross and other organizations to prioritize those zones for mobile clinics and water purification systems. Without these insights, response efforts would’ve likely missed the most impacted communities.
Resource Allocation That’s Smart, Not Blind
Every outbreak tests the limits of available resources. GIS enables smarter logistics by mapping not just where the cases are, but how to get resources to those locations efficiently. From identifying optimal sites for temporary health centers to routing vaccine distribution, GIS improves operational response on the ground.
For example, during the Ebola outbreak in West Africa (2014–2016), GIS was used to plan the placement of treatment centers and coordinate the movement of personnel across national borders. These insights were especially critical in rural areas with poor road infrastructure and minimal access to care.
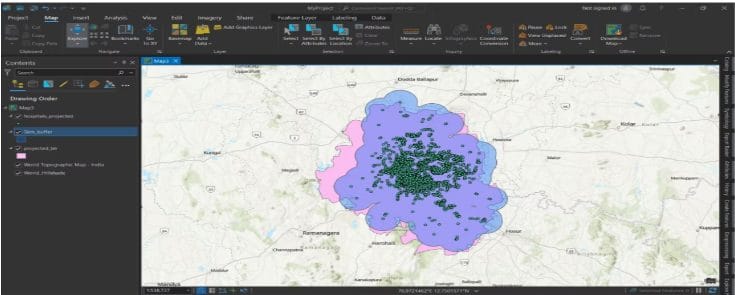
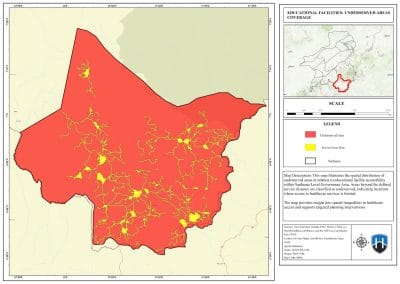
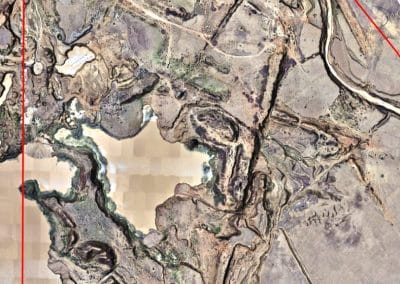
this image shows a 5km buffer created for each of these hospital locations. Buffer area shows the area covered by hospitals for emergency situations. As we can see There are few areas where the condition of 5km is not satisfied.
Ethical Use of Spatial Health Data
With great data comes great responsibility. Public health mapping must uphold strict ethical standards — protecting privacy, avoiding stigmatization, and ensuring consent in the use of personal health information. In politically unstable regions or marginalized communities, misuse of spatial data can cause harm. Transparency, local collaboration, and anonymization protocols are non-negotiable.
The Path Forward
GIS in public health isn’t just a tool for crisis. It’s a framework for prevention, equity, and resilience. As platforms integrate satellite data, mobile health apps, and AI-driven analytics, our ability to detect and control outbreaks will only grow more precise.
Today, platforms like HealthMap (built by researchers at Boston Children’s Hospital) monitor news and digital reports globally, using GIS to track emerging infectious diseases — often spotting them before traditional surveillance systems.
As the WHO stated during the Ebola crisis: “Maps became as important as stethoscopes.”