When we look at a satellite image, it’s easy to admire the big picture — colorful landscapes, weather patterns, vegetation cover, or even urban development. But behind every vivid map or image lies something deceptively simple: pixels. In raster data, each of these pixels is a tiny square packed with information. Even just one pixel can tell us more than you might imagine.
What Is a Raster Pixel, Really?
Raster data is a grid-based data format used in remote sensing and GIS. Each square in that grid — each pixel — represents a specific area on the ground. Depending on the resolution of the imagery, one pixel might cover 30 meters (as in Landsat), 10 meters (Sentinel-2), or even less than a meter (in high-resolution drone imagery).
But what makes a pixel valuable is what it contains: numerical values that correspond to reflected light across different parts of the electromagnetic spectrum. These values are stored in bands — Red, Green, Blue, Near-Infrared, Shortwave Infrared, and so on. This raw data can be used to analyze vegetation health, land cover types, soil moisture, mineral content, and more.
More Than Just a Color Dot
To the human eye, a pixel might just be a color on a screen. But behind that color is data — often several bands’ worth — that can be interpreted to reveal real-world information.
For example:
- In agriculture, a pixel might show the Normalized Difference Vegetation Index (NDVI), indicating how healthy crops are.
- In environmental monitoring, one pixel could suggest flooded land or deforestation.
- In mineral exploration, the spectral signature within a pixel could hint at lithium-rich pegmatites or copper-bearing formations.
- In urban planning, pixels can help map impervious surfaces like roads and rooftops.
Each of these interpretations comes from the values encoded in that single pixel.
Why Pixel-Level Analysis Matters
In many GIS and remote sensing workflows, we analyze patterns across many pixels. But zooming into the level of a single pixel can provide:
- Precision monitoring in sensitive areas (e.g., early signs of crop stress or pollution).
- Change detection when comparing pixels over time (e.g., land use changes).
- Training data for machine learning models that classify land cover or detect features.
- Pixel purity checks in spectral analysis, ensuring you’re studying a homogenous area.
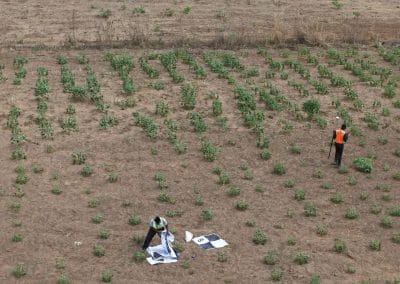
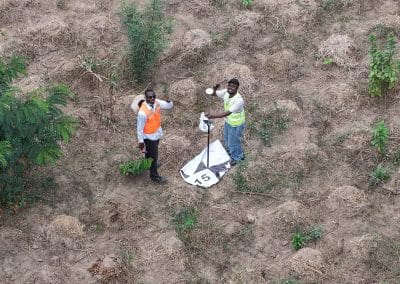
A Case in Point: The Story of One Pixel
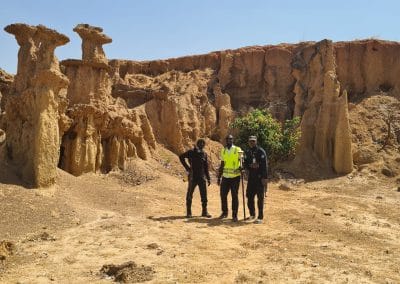
Imagine you’re studying a region in Osun State, Nigeria, for lithium exploration. You’ve used Landsat 8 imagery and calculated band ratios to detect likely pegmatite zones. One pixel stands out — it shows an anomalous spectral pattern. Upon ground-truthing, that very pixel corresponds to a site with visible lithium mineralization. Just like that, one pixel helped direct meaningful exploration.
Conclusion
In the world of raster data, no pixel is too small to matter. Each one is a container of geospatial intelligence — a puzzle piece that, when understood, can shape decisions in agriculture, mining, urban development, and environmental protection. So the next time you see a raster image, remember: that seemingly tiny square could be telling a powerful story.