IMPORTANCE OF REMOTELY SENSED SATELLITE DATA AND IMAGES
Introduction
Remotely sensed satellite data and images have fundamentally transformed the way humanity observes, understands, and manages the Earth’s surface and its dynamic processes. From the vast expanse of tropical rainforests to the intricate network of drainage basins, from the sprawling growth of urban centres to the fragile margins of polar ice sheets, satellite technology has rendered the previously invisible both visible and measurable. The importance of this technology cannot be overstated. It bridges the gap between ground-level observation and planetary-scale understanding, offering synoptic coverage that is spatially consistent, temporally repeatable, and physically quantifiable. Where traditional field surveys are constrained by time, cost, accessibility, and human capacity, satellite remote sensing transcends these limitations with remarkable efficiency. A single satellite overpass can capture what would take field teams months or even years to survey on foot.
In addition to that, In the earth sciences, remotely sensed data has proved invaluable in the extraction and analysis of morphometric parameters, the delineation of drainage basins, the mapping of stream networks, and the characterization of hydrological behavior across entire watersheds. The derivation of Digital Elevation Models from sensors such as SRTM and ASTER has enabled researchers to compute basin geometry, relief ratios, drainage density, and stream ordering at spatial resolutions and geographic extents previously unimaginable. These capabilities have elevated morphometric analysis from a laborious cartographic exercise to a rigorous, reproducible, and scalable scientific methodology.
Beyond hydrology, the applications of satellite imagery span agriculture, disaster response, urban planning, environmental conservation, climate science, and public health. The ability to detect subtle changes in land cover, soil moisture, vegetation stress, or surface water extent across seasons and decades equips scientists, planners, and policymakers with the evidence needed to make informed, timely, and life-saving decisions. As sensor technology continues to advance with increasing spectral resolution, finer spatial detail, and more frequent revisit cycles, the analytical potential of satellite remote sensing will only deepen. The integration of artificial intelligence and machine learning with satellite imagery further promises to unlock patterns and relationships that have long eluded conventional analysis.
Remotely Sensed Satellite Data
Remote sensing emerged as a fundamental tool in Earth observation, enabling the acquisition of spatial and temporal data without direct contact with the target surface. Remote sensing is the science of collecting information about objects or areas from a distance, typically using satellite or airborne sensor technologies. It relies on the detection and measurement of electromagnetic radiation (EMR) reflected or emitted from the Earth’s surface (Lillesand et al., 2015). Advances in satellite technology, particularly through programmes led by organisations such as NASA and European Space Agency, have significantly improved the availability and quality of remote sensing data. Remotely sensed satellite data refers to raw or processed numerical measurements collected by satellite sensors across different parts of the electromagnetic spectrum.
The characteristics of remotely sensed satellite data include:
- The data are stored as digital values (pixels with numbers), not just pictures
- The data includes multispectral, hyperspectral, thermal, and radar data
- Can be analysed quantitatively (e.g., vegetation indices like Normalised Difference Vegetation Index, NDVI)
- Requires processing and interpretation using GIS or remote sensing software
- Used for scientific analysis and modeling
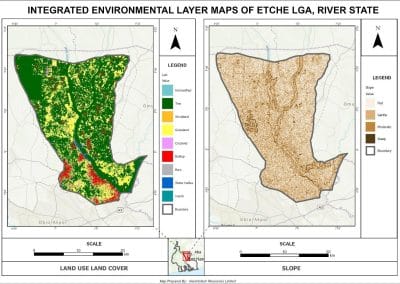
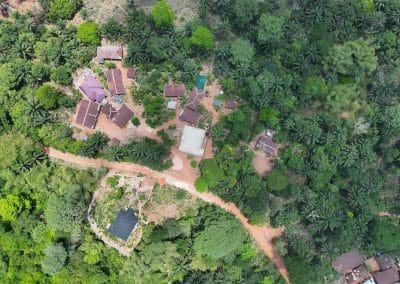
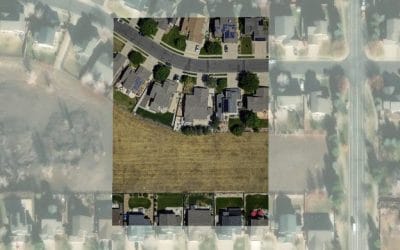
Examples of the uses of remotely sensed satellite data are climate monitoring, land use/land cover classification, and soil moisture and temperature estimation. Satellite images are visual representations (pictures) derived from remotely sensed data, often processed into formats that resemble photographs. Figure 1 shows a raster dataset from satellite imagery.
Characteristics of satellite images are:
(1) Designed for visual interpretation,
(2) Usually true-color or false-color composites,
(3) Easier to understand without technical tools,
(4) Less emphasis on raw numerical values, and
(5) Often used in platforms like Google Earth.
The uses or applications of satellite images include map reading and visualization, urban planning and disaster monitoring (e.g., floods, fires), etc. Figure 1 shows raster data from satellite imagery.
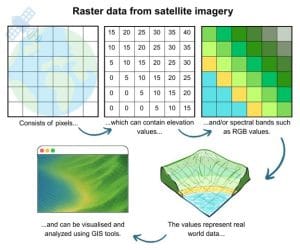
Figure 1: Raster data from Satellite Imagery
Importance of Remotely Sensed Satellite Data and Images of the Earth
The importance of remotely sensed satellite data and images of the Earth can be divided into four advantages compared to ground observations which include the nature of synoptic view, repetitive coverage, multispectral data and low-cost data.
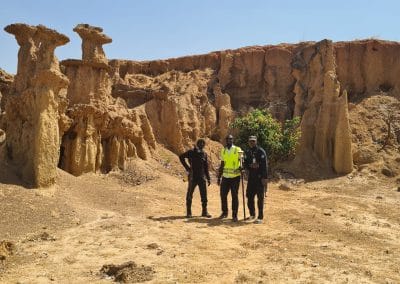
(a) Synoptic view
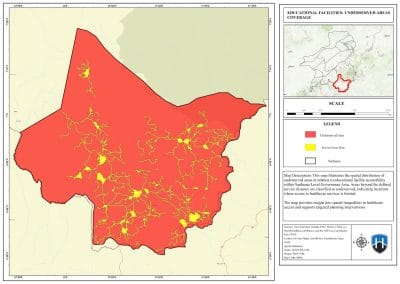
Satellite images are “big-picture” views of large areas of the surface. The positions, distribution, and spatial relationships of features are clearly evident; megapatterns within landscapes, seascapes, and icescapes are emphasized. Geology, ecology, hydrology, oceanography, glaciology. Figure 2 shows the synoptic view of mega pattern visible across thousand of km and Change Detection of Lake. Major biologic, tectonic, hydrologic, and geomorphic factors stand out distinctly. The major characteristics of Synoptic view of satellite images:
- Wide-area, single-pass coverage spanning hundreds to thousands of kilometres.
- Simultaneous capture of spatial relationships between biologic, tectonic, hydrologic, and geomorphic features.
- Megapatterns: landscape mosaics, drainage networks, fault systems, vegetation zones are clearly visible at a glance.
- Provides context that no ground-level survey can replicate.
A single satellite pass (Figure 2) captures biologic (vegetation), hydrologic (rivers, oceans), tectonic (mountain ridges), and geomorphic (deserts) patterns simultaneously across thousands of kilometers and spatial relationships without ground survey could capture in one snapshot.
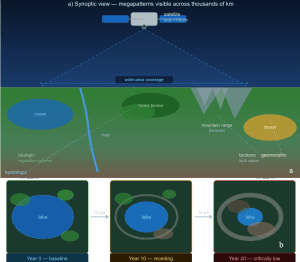
Figure 2: Synoptic View: (a) Mega Pattern Visible across Thousands of km, (b) Change Detection of Lake over Time (How fast environment is changing)
(b) Repetitive coverage
Repeated images of the same regions, taken at regular intervals over periods of days, years, and decades, provide data bases for recognizing and measuring environmental changes. This is crucial for understanding where, when, and how the modern environment is changing. The key characteristics of repetitive coverage are:
- Systematic revisit cycles from daily (weather satellites) to 16-day (Landsat) and create time-series archives.
- Change detection algorithms compare multi-date images to quantify area, rate, and direction of change.
- Long-term records spanning decades allow distinction between natural variability and human-induced trends.
- Critical for climate monitoring, disaster assessment, and resource management.
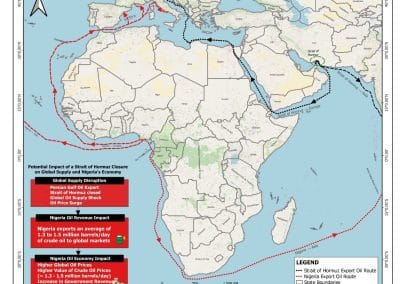
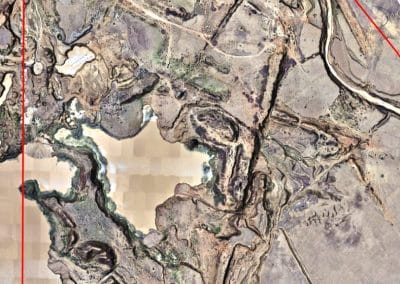
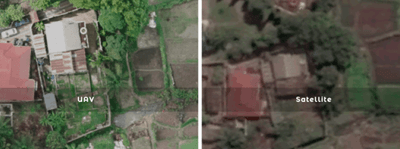
In repetitive coverage, the same lake region imaged at Year 0, 10, and 20 (Figure 3) shows systematic shrinkage. Comparing images from the same orbit track at regular intervals builds a baseline for measuring where, when, and how fast environmental change is occurring. In Figure 3a each band reveals different material composition and physical conditions. The same scene but different sensor bands reveal different information (Figure 3b). Combining bands unlocks richer analysis than any single band alone.
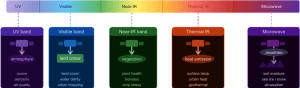
Figure 3a: Earth’s surface / atmosphere
![]()
Figure 3b: Multispectral fusion
(c) Multispectral Data
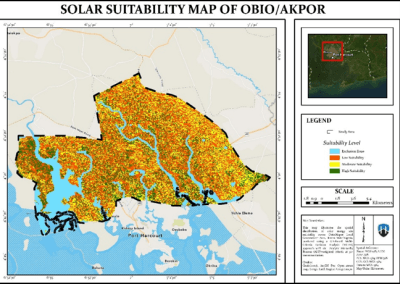
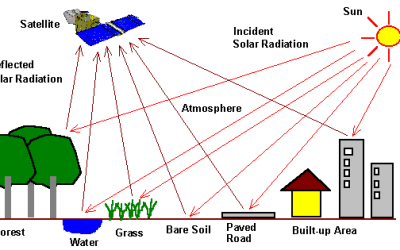
Satellite sensors are designed to operate in many different portions of the electromagnetic spectrum (Figure 4a). Ultraviolet, visible, infrared, and microwave energy coming from the Earth’s surface or atmosphere contain a wealth of information about material composition and physical conditions. Satellite sensors are tuned to distinct windows across the EM spectrum. UV reveals atmospheric aerosols, visible light maps land cover, near-IR highlights vegetation health, thermal IR detects surface temperatures, and microwave/SAR penetrates clouds to image soil moisture and ice. Each band unlocks a different layer of information about the same scene. Figure 4b illustrates the characteristics of ground survey.
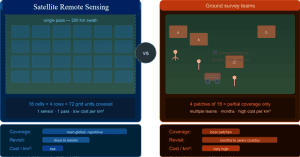
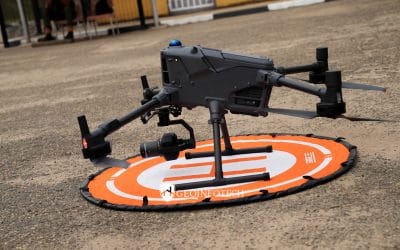
Figure 4: (a) Satellite Sensor (b) Ground Survey
Satellite sensors collect near-global, multispectral, repetitive data at a fraction of the cost of equivalent ground surveys (the economic case for remote sensing). Table 1 reveals different spectral bands and their applications.
Table 1: Spectral Bands and their Applications
| Band | Wavelength range | Key applications |
| Ultraviolet (UV) | < 0.4 μm | Ozone monitoring, aerosol detection, air quality |
| Visible (Blue, Green, Red) | 0.4 – 0.7 μm | Land cover mapping, water clarity, urban mapping |
| Near-Infrared (NIR) | 0.7 – 1.3 μm | Vegetation health (NDVI), biomass, crop stress |
| Short-Wave IR (SWIR) | 1.3 – 3.0 μm | Mineral mapping, soil moisture, fire detection |
| Thermal Infrared (TIR) | 3 – 14 μm | Surface temperature, urban heat islands, geothermal |
| Microwave / SAR | 1 mm – 1 m | All-weather imaging, sea ice, soil moisture, floods |
Combining multiple spectral bands (band compositing and indices such as NDVI, NDWI, and NBR) reveals information invisible to the human eye, enabling precise classification of surface materials and monitoring of dynamic physical conditions.
(d) Low-cost data
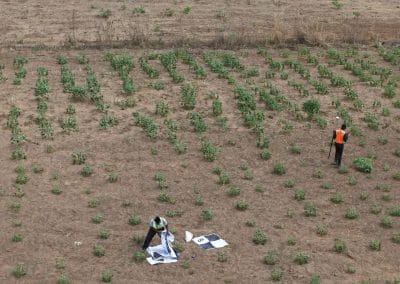
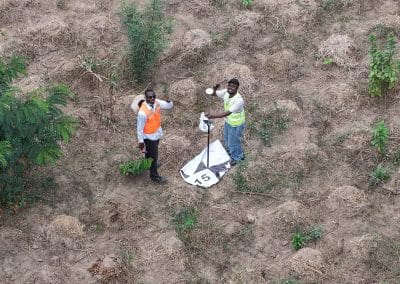
Near-global, repetitive collection of data is far cheaper using satellite sensors than collecting the same type and quantity of data would be through conventional ground surveys. A single satellite pass covers 72+ grid units of the same area that ground teams. This only partially sample at great expense in time and money. The satellite approach scales to near-global coverage with consistent, repeated acquisition, while ground surveys remain slow, patchy, and expensive per km². The remotely sensed satellite data and images of the Earth have several advantages over ground survey data.
The following are the advantages of remotely sensed satellite data and images of the Earth:
- A single satellite acquires data over millions of km² per day at a fixed operational cost, making the per-km² unit cost extremely low.
- Ground surveys require personnel, vehicles, equipment, and logistics that scale linearly (or worse) with area — costs become prohibitive over large or remote regions.
- Satellite data archives are freely available from agencies such as NASA, ESA, and USGS, further reducing access costs.
- Consistent, automated collection eliminates the inconsistency and subjectivity inherent in distributed ground teams.
- Revisit capability at no additional marginal cost per pass enables monitoring programs that would be economically impossible on the ground.
The difference between data acquisition through remote sensing (satellite sensor) and ground survey are shown in Table 2.
Table 2: Difference between Data Acquisition through Remote Sensing (Satellite Sensor) and Gound Survey
| Factor | Satellite Sensor | Ground Survey |
| Coverage per day | Millions of km² | Local patches only |
| Revisit cost | Near zero marginal cost | Proportional to area |
| Speed | Near-real-time | Weeks to years |
| Consistency | Automated, objective | Variable by team |
| Remote access | Any terrain, any climate | Often inaccessible |
| Data archive | Decades of free data | Limited historical records |
Together, these four properties: synoptic view, repetitive coverage, multispectral sensing, and low-cost data acquisition make satellite remote sensing the most powerful tool available for monitoring and understanding Earth’s dynamic environment at regional to global scales. Table 3 reveals the characteristics of remotely sensed satellite data, satellite images and ground observations
Table 3: Characteristics of Remotely Sensed Satellite Data, Satellite Images and Ground Observations
| Feature | Remotely Sensed Satellite Data | Satellite Images | Ground Observations |
| Nature | Numerical data (digital values) | Visual images (pictures) | Physical measurements |
| Source | Satellite sensors | Processed satellite data | Field instruments/humans |
| Coverage | Large/global | Large/global | Local/specific |
| Detail | Moderate–high (depends on sensor) | Moderate (visual clarity) | Very high (site-specific) |
| Analysis | Quantitative (scientific) | Qualitative (visual) | Quantitative & qualitative |
| Processing | Requires specialized software | Minimal for viewing | Minimal (but field work needed) |
| Role | Data source for analysis | Visualization tool | Validation & calibration |
The increasing demand for geospatial data in environmental monitoring, agriculture, and urban development has made remote sensing a critical component of modern scientific and policy frameworks (Campbell & Wynne, 2011).
Conclusion
The importance of remotely sensed satellite data and images represent not merely a technological convenience, but an essential pillar of modern environmental science and spatial analysis. They have democratised access to Earth observation, empowered researchers across disciplines, and provided an irreplaceable foundation for understanding the planet we inhabit. To ignore their significance would be to turn away from one of the most powerful scientific instruments ever placed in service of human knowledge.
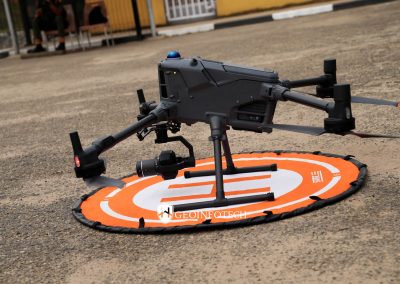
Contact Geoinfotech Resources Limited for professional and exceptional drone mapping or surveying training and other relevant services. Geoinfotech Resources Limited is a surveying and GIS company that is well equipped for rendering services in different sectors including agriculture, land survey, environmental monitoring, oil and gas survey/inspection, education, estate planning and management, construction, engineering etc. We are also the famous and reliable suppliers of GIS and surveying instruments to individuals and organisations within Nigeria and abroad.