Flood risk analysis in ArcGIS Pro helps identify flood-prone areas using Digital Elevation Model (DEM), land use, rainfall, and hydrological data. Here’s a detailed step-by-step guide:
Step 1: Collect and Prepare Data
You need the following datasets:
✅ Digital Elevation Model (DEM) – Extract from SRTM, ASTER, or LiDAR.
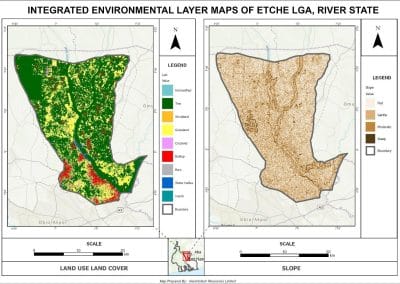
✅ Land Use/Land Cover (LULC) – From Landsat, Sentinel-2, or local sources.
✅ Soil Data – From FAO, USGS, or local geological agencies.
✅ Rainfall Data – From meteorological agencies or TRMM satellite data.
✅ Flood Historical Data – Past flood occurrences (optional but useful).
Prepare the Data in ArcGIS Pro
- Import all datasets into ArcGIS Pro and check the coordinate system.
- Clip datasets to the study area using Clip (Raster or Vector) tool.
- Convert all vector data to raster (if necessary) using Polygon to Raster.
Step 2: Generate Hydrological Features
Use the Spatial Analyst Hydrology Tools to extract drainage features from DEM.
Fill Sinks in DEM
- Open Geoprocessing Tools (Analysis tab → Tools).
- Search for Fill and apply it to remove artificial depressions in DEM.
Generate Flow Direction
- Open Flow Direction tool.
- Set the Input DEM (fill).
- Run the tool to generate a flow direction raster.
Generate Flow Accumulation
- Open Flow Accumulation tool.
- Use the Flow Direction output as input.
- This calculates water accumulation across the terrain.
Extract Stream Network
- Use Raster Calculator with an appropriate threshold: E.g:(“Flow_Accumulation” > 20000)
- Convert the result to a polyline using Stream to Feature tool.
Step 3: Generate Flood Risk Map
Flood hazard zones depend on slope, elevation, land cover, and rainfall.
Reclassify Elevation & Slope
- Open Slope tool (from DEM) → Generate a slope raster.
- Use Reclassify tool to categorize slope into classes (e.g., Low, Moderate, High).
- Repeat Reclassify for DEM to define low-lying flood-prone areas.
Reclassify Land Use & Soil
- Use Reclassify tool to categorize land use into urban, vegetation, water, bare land.
- Soil types affecting infiltration can also be reclassified.
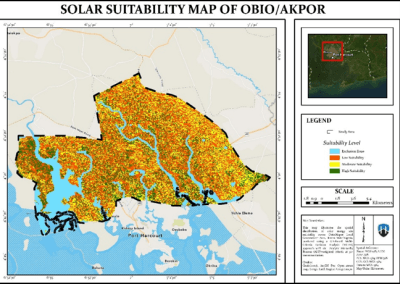
Weighted Overlay Analysis
- Open Weighted Overlay tool.
- Add the following layers: ✅ Slope
✅ Elevation (DEM Reclassified)
✅ Land Use
✅ Soil Permeability
✅ Flow Accumulation - Assign weights based on flood contribution (e.g., Slope = 30%, DEM = 20%, Land Cover = 25%, Soil = 25%).
- Run the tool to generate a flood risk map.
Step 4: Identify Vulnerable Areas
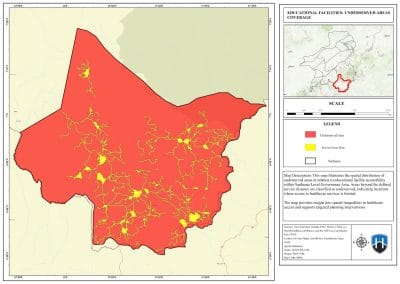
Overlay Flood Risk with Population & Infrastructure
- Use Intersect tool to overlay the flood map with roads, buildings, and population layers.
- Use Zonal Statistics to assess affected population.
Create Risk Map
- Classify risk into Low, Moderate, and High Flood Risk Zones.
- Symbolize results for better visualization.
Step 5: Generate Final Flood Risk Maps
- Apply Symbology to display flood risk zones clearly.
- Generate Flood Susceptibility and Vulnerability Maps.
- Export maps in PDF, PNG, or Shapefile format for reports.