Imagine holding a key that unlocks the hidden patterns of our world—the spread of cities, the retreat of forests, or the flow of traffic through a bustling metropolis. That key is Geographic Information Systems (GIS), quietly shaping the way we understand and interact with our environment.
Maps have always been a cornerstone of human navigation and understanding of the world. However, with the advent of GIS, maps have evolved from static visuals to dynamic tools for solving real-world problems. GIS integrates spatial data—the “where”—with attribute data—the “what”—to provide a multi-dimensional view of the world. Whether it’s tracking urban growth or mapping wildlife habitats, GIS combines data and geography in ways that transform decision-making and storytelling.
The Core of GIS
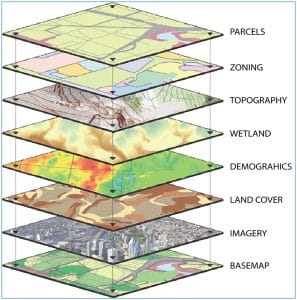
Layers and Coordinates At the heart of GIS lies the concept of layers. Think of each layer as a sheet of transparent paper, where one layer might represent roads, another rivers, and yet another population density. These layers stack together to form a complete picture of a region. Coordinates act as the glue that holds these layers together, ensuring every feature—whether a city or a tree—is positioned accurately on the map.
Data Types
Spatial Meets Attribute Spatial data answers the question “Where?” and includes points, lines, and polygons representing geographic features. Attribute data, on the other hand, answers “What?” For instance, a point on a map might represent a school (spatial data), while its attributes could include the number of students, teachers, and facilities available.
When spatial and attribute data merge, they create a powerful combination. A simple map of schools can evolve into an analytical tool to identify regions with insufficient educational infrastructure or predict future needs based on population growth.
Applications of GIS: Real-World Examples
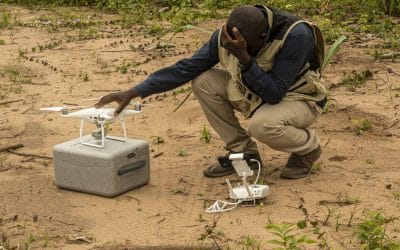
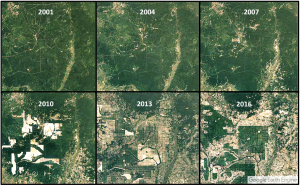
Tracking Deforestation Using satellite imagery and GIS, researchers can monitor forest cover changes over time. By overlaying layers of land use, protected areas, and logging activities, GIS can identify regions at high risk of deforestation and help policymakers enforce conservation strategies.
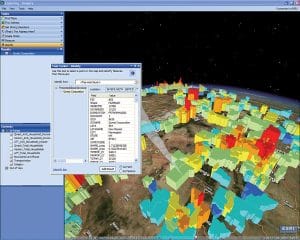
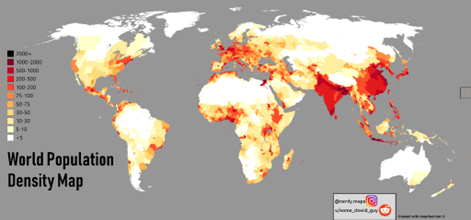
Visualizing Population Density Governments use GIS to map population density and allocate resources effectively. By combining demographic data with spatial locations, GIS provides insights into urban planning, transportation needs, and emergency response strategies.
Disaster Management In times of natural disasters, GIS plays a crucial role. For example, during floods, GIS can integrate rainfall data, river systems, and elevation to identify vulnerable areas and plan evacuation routes.
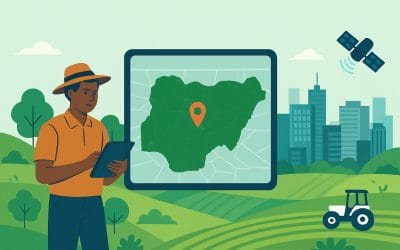
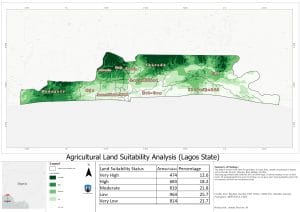
In Nigeria, GIS has been instrumental in areas like urban planning, agriculture, and disaster response. For instance, GIS is used to map flood-prone areas in Lagos, track desertification in the northern regions, and optimize transportation routes in major cities. In agriculture, it supports precision farming by analyzing soil types and crop suitability.
Analyzing Maps
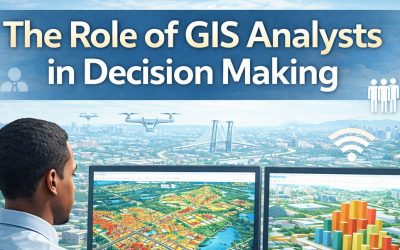
Beyond the Visual GIS isn’t just about creating maps—it’s about analyzing them. For example, spatial analysis can uncover patterns like the clustering of diseases in certain areas, while network analysis helps optimize delivery routes for logistics companies. These capabilities turn raw data into actionable intelligence.
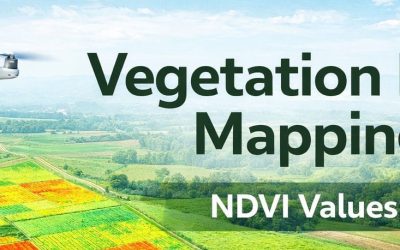
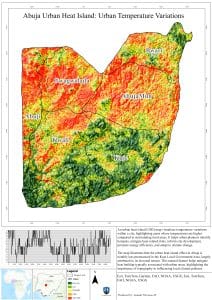
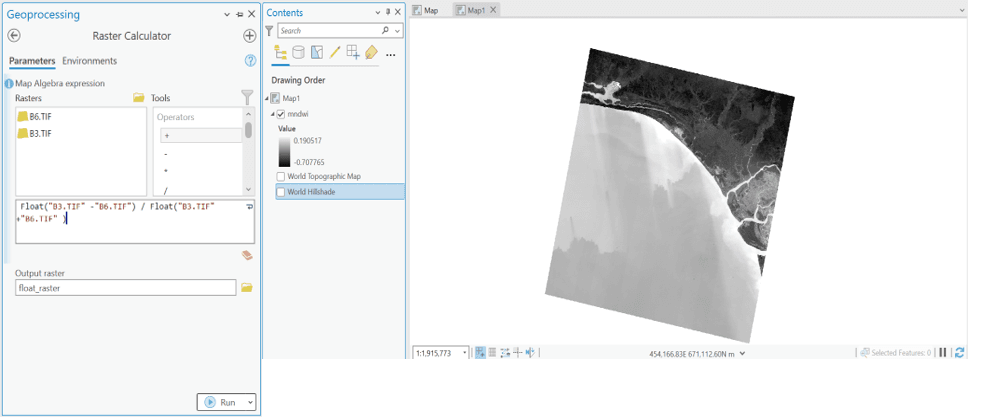
Another critical component is raster data, which represents information in grid-based formats, such as elevation models or satellite imagery. Raster data allows for advanced analysis like identifying vegetation health, predicting flood zones, or calculating land surface temperature. Combining raster with vector data adds depth to GIS projects, enabling more robust decision-making.
GIS is more than a mapping tool; it’s a lens through which we understand our world better. By integrating spatial and attribute data, GIS bridges the gap between raw numbers and meaningful insights. Whether tackling environmental challenges, improving urban infrastructure, or planning for the future, GIS empowers us to make smarter, data-driven decisions. The next time you look at a map, remember—it’s not just a picture. It’s a story waiting to be told.