Abstract
The growing demand for clean and sustainable energy has necessitated the systematic identification of optimal sites for solar energy installations in rapidly urbanising regions. This study presents a geospatial assessment of solar energy site suitability across Obio/Akpor Local Government Area (LGA), Port Harcourt, Rivers State, Nigeria. The research integrates drone-derived Digital Surface Models (DSM), Sentinel-2 satellite imagery, ERA5 Global Horizontal Irradiance (GHI) data, and OpenStreetMap infrastructure layers within a Geographic Information System (GIS) environment, applying a Multi-Criteria Decision Analysis (MCDA) framework underpinned by the Analytic Hierarchy Process (AHP).
Six evaluation criteria were assessed: solar irradiance (GHI), land use and land cover (LULC) suitability, terrain slope, proximity to roads, proximity to railways, and proximity to buildings. AHP-derived weights were assigned to each criterion, with solar irradiance carrying the highest influence at 35 percent. A binary water exclusion mask was applied post-analysis to remove unsuitable areas associated with the Niger Delta creek network. The final suitability output was classified into three categories: High (34 percent of the study area), Moderate (41 percent), and Low (18 percent), with 7 percent excluded as water zones. Results indicate that the most viable locations for solar energy deployment are concentrated in the northern and northeastern peri-urban zones of Obio/Akpor LGA. The AHP Consistency Ratio of 0.047, below the acceptable threshold of 0.10, confirms the methodological robustness of the weight derivation. The findings provide actionable spatial intelligence for urban planners, energy policymakers, and renewable energy investors in the Niger Delta region.
Keywords: Solar Energy Suitability, GIS-MCDA, AHP, Obio/Akpor LGA, Niger Delta, Remote Sensing, Drone Survey, Sentinel-2, GHI, Weighted Overlay
- INTRODUCTION
Energy plays a central role in socio-economic development due to its wide applications across residential, commercial, and industrial sectors. However, the increasing demand for electricity, coupled with the environmental consequences of fossil fuel dependence, has intensified the global transition toward renewable energy sources. Fossil fuels such as coal, oil, and natural gas account for a significant proportion of global energy consumption, yet their combustion releases greenhouse gases that contribute to climate change and global warming (Aliyu et al., 2015). International efforts, such as the Paris Climate Agreement, have emphasized the need to limit global temperature rise to below 2°C, with further efforts toward 1.5°C, thereby reinforcing the urgency for sustainable energy alternatives (United Nations, 2015).
The massive demand for energy resources over the limited supply of non-renewable resources requires looking for alternatives. The global shift to renewable energy is driven by climate change and the need for sustainable power sources, with solar energy being highly viable in tropical regions. In the Philippines, policies like Republic Act No. 9153 have supported solar energy growth, with 903 MW installed in 2016 and plans for expansion to reduce reliance on fossil fuels. Given the country’s strong solar radiation (4.5–5.5 kWh/m²/day). (Loquias et. al 2022). In Iran, solar energy is a cost-effective and promising renewable resource due to favorable climatic conditions. It helps reduce pollution and dependence on fossil fuels. The main technologies include Concentrated Solar Power (CSP) and Photovoltaics (PV), with studies showing up to 60 GW potential in a 2000 km² area. Its adoption is increasing due to its reliability and low maintenance (Najafi et, al 2015).
Among renewable energy sources, solar energy has emerged as one of the fastest-growing and most promising options, particularly in tropical regions where solar radiation is abundant. Countries located within low latitudes receive substantial solar irradiance throughout the year, making solar power a viable and sustainable solution to energy deficits. Nigeria, situated between latitudes 4°N and 14°N, is endowed with high solar radiation levels ranging from 3.5 to 7.0 kWh/m²/day, placing it among the most solar-rich nations globally (Ohunakin et al., 2013; Salihu et al., 2024). Despite this vast potential, the adoption of solar energy technologies in many parts of Nigeria remains limited due to inadequate planning frameworks, lack of spatial data, and insufficient integration of environmental and infrastructural considerations (Ikejemba et al., 2017).
Effective solar energy deployment requires careful site selection based on multiple criteria, including solar radiation, land use, terrain characteristics, and proximity to infrastructure. Traditional approaches to site selection often rely on coarse or non-spatial datasets, which fail to capture the spatial variability and complexity of environmental conditions. Consequently, there has been a growing application of geospatial technologies, particularly Geographic Information Systems (GIS) and Remote Sensing (RS), in solar energy planning. GIS provides a robust platform for integrating, analyzing, and visualizing spatial data, while remote sensing offers reliable and cost-effective means of acquiring environmental information over large areas (Hammer et al., 2003; Huang et al., 2019).
In recent years, Multi-Criteria Decision Analysis (MCDA), particularly when combined with the Analytical Hierarchy Process (AHP), has been widely adopted in GIS-based solar suitability studies. This approach enables the integration of diverse criteria—such as solar irradiance, slope, elevation, land use, and accessibility—into a unified decision-making framework, thereby improving the accuracy and reliability of site selection (Saaty, 1980; Sanchez-Lozano et al., 2013). Several studies have demonstrated the effectiveness of GIS-MCDA techniques in identifying optimal locations for solar farms, particularly in developing countries where energy planning challenges are pronounced (Janke, 2010; Doorga et al., 2019; Raza et al., 2023).
Furthermore, advancements in cloud-based geospatial platforms such as Google Earth Engine (GEE) have enhanced the accessibility of high-quality environmental datasets, including solar irradiance products derived from satellite observations. Although these datasets have been widely used for large-scale solar potential assessments, their application at local scales remains limited, particularly when not integrated into GIS-based decision-support frameworks (Sari et al., 2023). The lack of high-resolution, localized spatial data continues to hinder effective solar energy planning in many regions.
In Nigeria, several solar energy initiatives have been implemented; however, many have faced sustainability challenges due to inadequate consideration of environmental, socio-economic, and locational factors (Akinosun, 2017; Ikejemba et al., 2017). This highlights the need for a comprehensive, spatially explicit approach to solar site suitability assessment. The Niger Delta region, characterized by complex environmental features such as wetlands, floodplains, and dense urban development, presents unique challenges that necessitate detailed geospatial analysis (Adelakun, 2019).
Obio/Akpor Local Government Area, located within the Port Harcourt metropolitan region, exemplifies these challenges. The area is experiencing rapid urbanization, increasing energy demand, and persistent power supply issues. Despite its favorable solar potential and infrastructural accessibility, there is currently a lack of high-resolution spatial analysis to guide solar energy development within the area. Therefore, integrating GIS, remote sensing, and MCDA techniques provides a viable approach to systematically evaluate solar energy suitability.
This study aims to assess the spatial distribution of solar energy potential and identify optimal sites for solar energy development in Obio/Akpor LGA through the integration of environmental, technical, and infrastructural factors. By utilizing satellite-derived solar irradiance data, terrain analysis, land use classification, and proximity modeling within a GIS-MCDA framework, the study seeks to generate a comprehensive suitability map that can support informed decision-making in renewable energy planning.
- METHOLODY
2.1 Study Area
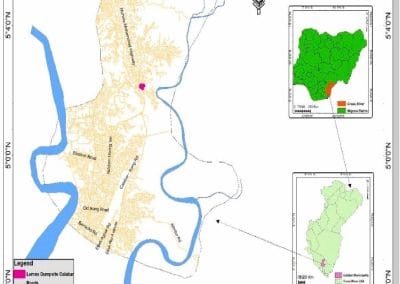
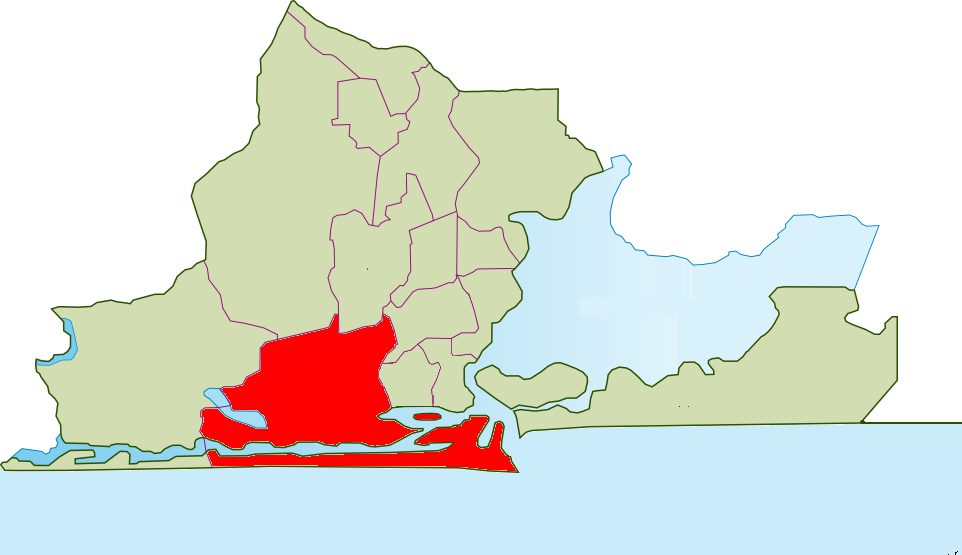
Obio/Akpor Local Government Area (LGA), located in Rivers State within the Niger Delta region of southern Nigeria (Figure 1.1), lies approximately between latitudes 4°45′N and 4°60′N and longitudes 6°50′E and 8°00′E, forming part of the rapidly urbanizing Port Harcourt metropolis (National Population Commission, 2006). The area experiences a tropical monsoon climate characterized by high temperatures, humidity, and annual rainfall exceeding 2000 mm, with distinct wet and dry seasons (Nigerian Meteorological Agency, 2020).
Land use and land cover (LULC) in Obio/Akpor is dominated by built-up areas, vegetation, wetlands, and water bodies, reflecting rapid urban expansion driven by population growth and economic activities (Obaideen et al., 2023). The terrain is generally low-lying and relatively flat, with elevations below 100 m, making it suitable for solar energy installations (Kouhestani et al., 2018). However, environmentally sensitive areas such as wetlands require exclusion to ensure sustainable development (Adelakun & Olanipekun, 2019). Overall, the combination of favorable solar potential, urban growth, and infrastructure makes Obio/Akpor LGA suitable for GIS-based solar energy site suitability analysis using MCDA.
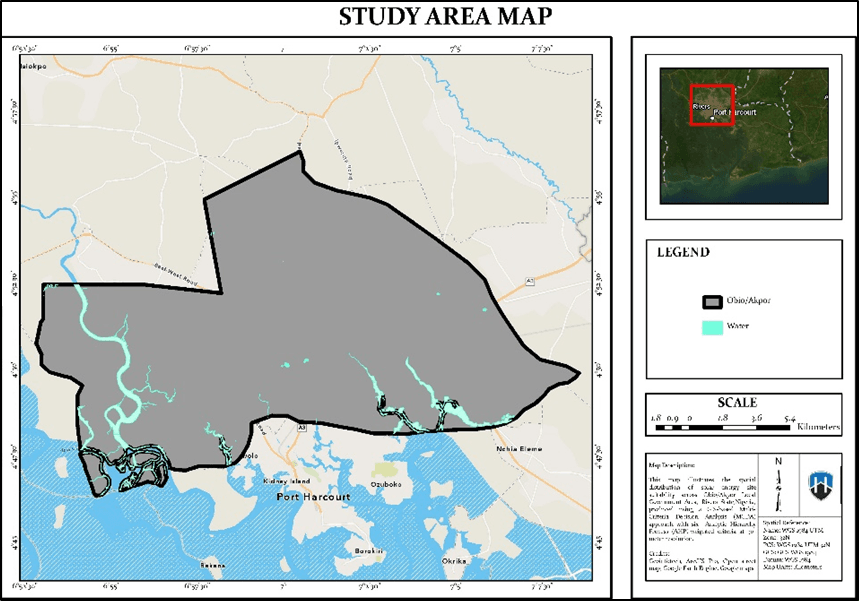
Figure 1.1: The study Area
Adapted from: ArcGIS Pro,Authors’ Compilation, 2026
2.2 Methods
The methodology is divided into three main stages. The first stage involves acquiring and processing satellite data to derive land use/land cover and solar radiation (GHI) using Google Earth Engine. The second stage focuses on spatial analysis in ArcGIS Pro, where all criteria (LULC, slope, infrastructure proximity, and constraints) are reclassified and integrated using a GIS-based MCDA with AHP weighting to determine land suitability. The final stage produces a solar suitability map by combining all weighted criteria and excluding unsuitable areas, identifying optimal locations for solar energy development. A schematic diagram illustrating the methodological framework is presented in Figure 2.1
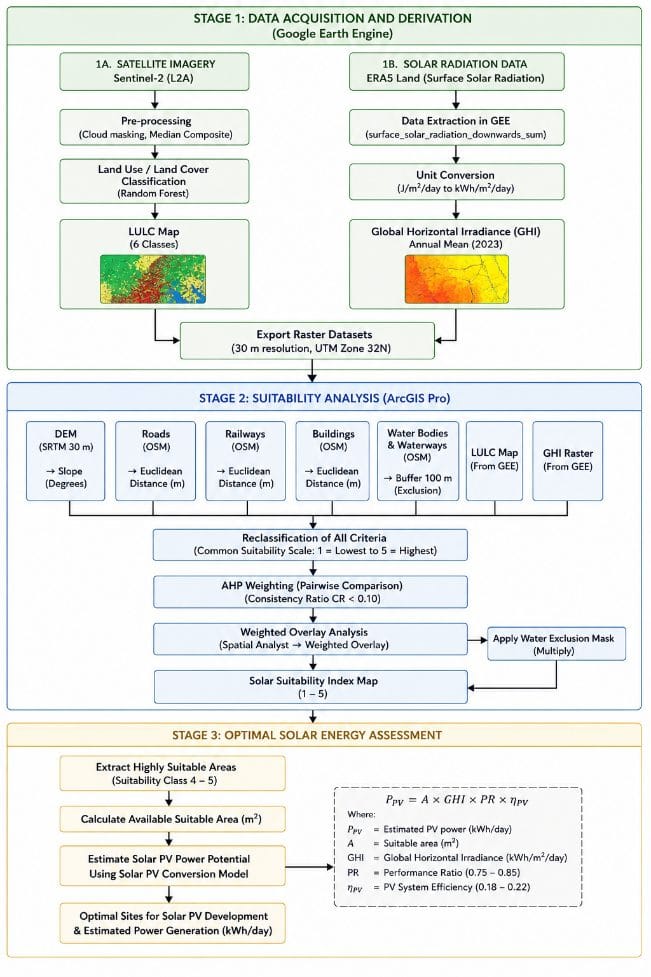
Figure 2.1: Methodological Framework for Geospatial Assessment of Solar Energy Site Suitability
Source: Authors’ Compilation, 2026
2.3 Data Acquisition and Analysis Tools
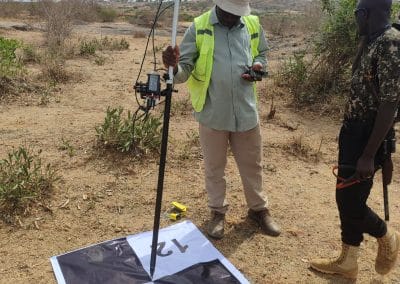
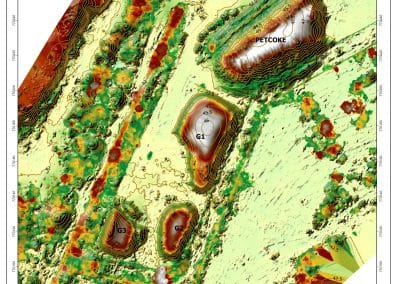
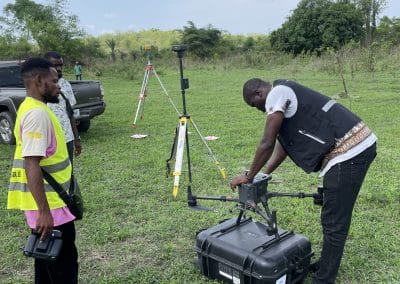
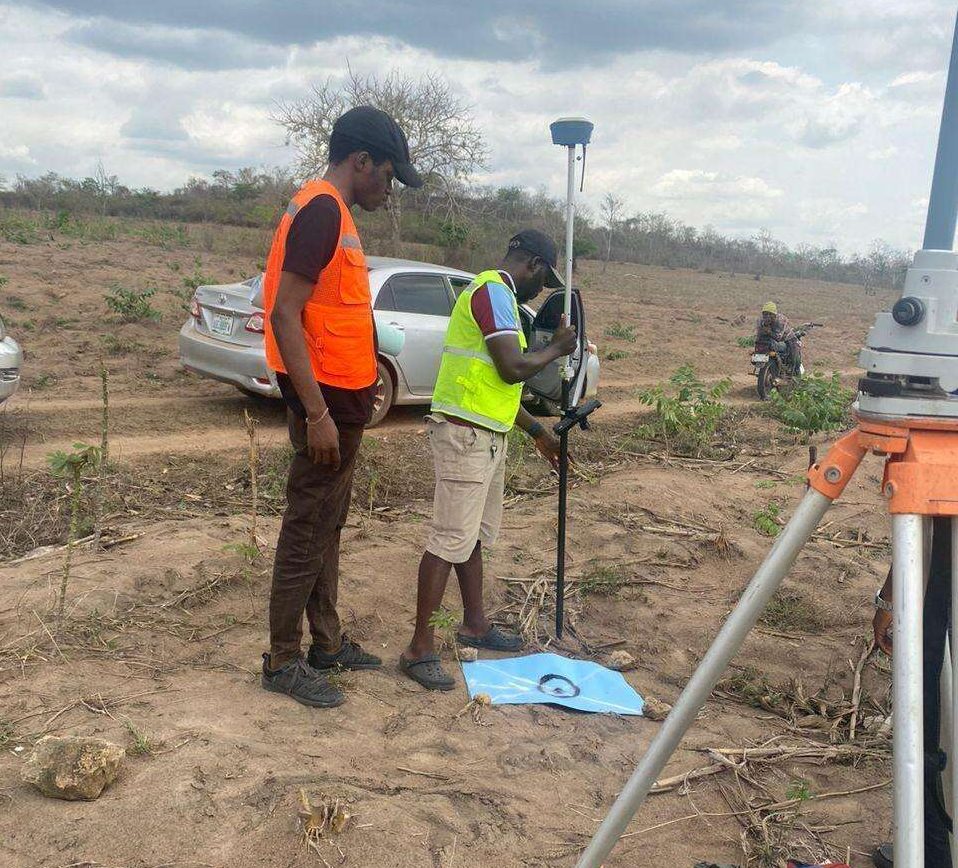
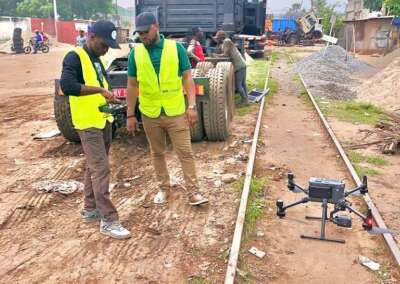
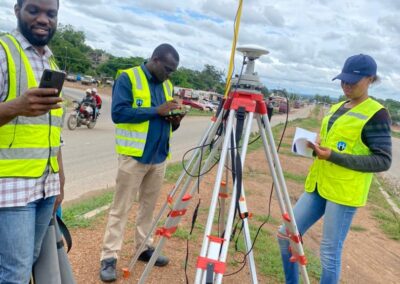
The data acquisition stage involves collecting and preparing all spatial datasets required for the analysis. Satellite imagery from Sentinel-2 is used for land use and land cover (LULC) classification, while ERA5 solar radiation data is processed in Google Earth Engine to derive Global Horizontal Irradiance (GHI). Supporting datasets such as SRTM Digital Elevation Model, drone-derived terrain data, and OpenStreetMap layers (roads, buildings, and water bodies) are also obtained. All datasets are harmonized to a common coordinate system and resolution to ensure consistency for further spatial analysis.
The study employed ArcGIS Pro for spatial data processing, analysis, and map production. ArcGIS Pro provides a comprehensive GIS environment for managing, visualizing, and analyzing spatial datasets, including raster and vector data integration and high-quality cartographic output.
Data reclassification was carried out using the Spatial Analyst extension. This process involved converting continuous raster values into a standardized five-class suitability scale ranging from 1 (least suitable) to 5 (most suitable), based on their relevance to solar energy development. In addition, a buffer raster was created for the water exclusion zone to eliminate areas unsuitable for solar installations. Water bodies and waterways were buffered and converted into a raster mask, which was later used to exclude these zones from the final suitability analysis.
Table 1:
| Criterion | Score 5 (Best) | Score 4 | Score 3 | Score 2 | Score 1 (Worst) | % Influence |
| GHI (kWh/m²/day) | ≥ 5.5 | 5.0-5.5 | 4.5-5.0 | 4.0-4.5 | < 4.0 | 35% |
| LULC Class | Bare land | Sparse veg. | Dense veg. | Built-up | Water/Wetland | 23% |
| Slope (degrees) | 0-3° | 3-8° | 8-15° | 15-25° | > 25° | 18% |
| Road distance (m) | 0-500 | 500-1000 | 1000-2000 | 2000-3500 | > 3500 | 12% |
| Railway distance (m) | 0-1000 | 1000-3000 | 3000-6000 | 6000-10000 | > 10000 | 7% |
| Building distance (m) | > 500 | 300-500 | 200-300 | 100-200 | < 100 | 5% |
The weighted overlay tool was then applied to integrate all criteria, including solar radiation, slope, land use/land cover, elevation, and proximity to roads, railways, and buildings. Each layer was assigned a relative weight according to its importance in solar site suitability. The final output was a solar suitability map of Obio/Akpor LGA, identifying areas most suitable for solar energy development to support planning and decision-making.
- RESULTS AND DISCUSSIONS
The study focuses on the development of a suitability map for solar energy potential in selected locations in Obio/Akpor Local Government Area, Rivers State.
3.1 Solar Irradiance (GHI- Global Horizontal Irradiance)
Annual mean Global Horizontal Irradiance (GHI) was derived from the ERA5 Land dataset in Google Earth Engine for 2023, converted to kWh/m²/day, and resampled to 30 m resolution in UTM Zone 32N. GHI values in Obio/Akpor range from about 1.5 to 4.8 kWh/m²/day, with an average of 3.6 kWh/m²/day, and show seasonal variation—higher in the dry season (~5.2 kWh/m²/day) than in the wet season (~4.2 kWh/m²/day).
Figure 3.1 indicates that most of Obio/Akpor LGA falls within high to very high solar potential zones (orange to red), suggesting strong suitability for solar photovoltaic development. Lower suitability areas are limited and mainly associated with water bodies, wetlands, and built-up zones, particularly in the southern and eastern parts of the LGA.
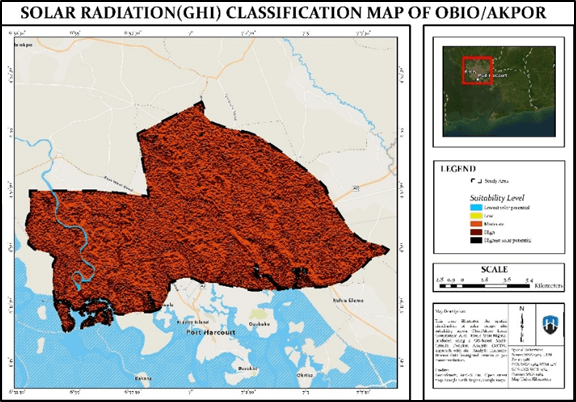
Figure 3.1: Map showing solar radiation (GHI) classification of the study area
Source: Authors’ Compilation, ArcGIS Pro, 2026
3.2 Suitable Land Area
Studies that apply Geographic Information Systems (GIS) to identify optimal locations for solar power plants consider multiple criteria, including terrain characteristics (such as slope, elevation, and aspect), accessibility to road networks, and land use/land cover conditions.
3.2.1 Slope
A slope raster was derived from the SRTM 30-metre Digital Elevation Model using the ArcGIS Pro Slope tool (Spatial Analyst toolbox), with output units in degrees. Slope values across Obio/Akpor LGA were predominantly in the 0 to 5 degree range, consistent with the flat topography of the Niger Delta. Less than 2 percent of the study area exhibited slopes exceeding 8 degrees, meaning that the large majority of the LGA presents no terrain-based barriers to solar energy development. The relative flatness of the terrain is reflected in the reclassified slope raster, where scores of 4 or 5 predominate, contributing positively to the overall suitability index across most of the study area.
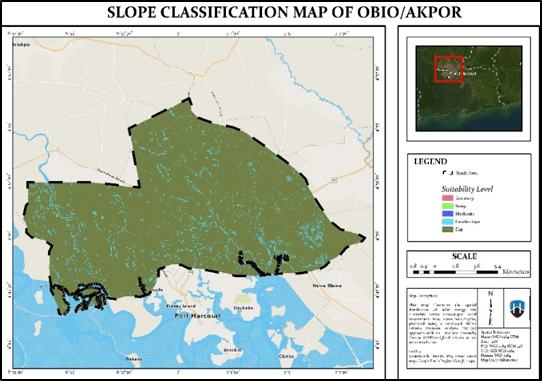
Figure 3.2: Map showing the Slope classification of the study area
Source: Authors’ Compilation, ArcGIS Pro, 2026
3.2.2 Land Use and Land Cover
Sentinel-2 Level-2A imagery was acquired for the dry season (November 2023–February 2024) to reduce cloud cover. A median composite (<10% cloud) was generated using the QA60 mask, incorporating key spectral bands and indices (NDVI, NDWI, NDBI, and MNDWI). Supervised classification using the Random Forest algorithm (100 trees) in Google Earth Engine identified six land cover classes: built-up, vegetation, farmland, bare land, water bodies, and wetlands.
Results show that wetlands/mangroves dominate (30.0%), followed by built-up areas (21.0%) and dense vegetation (17.9%). Bare land, most suitable for solar siting, accounts for 9.6% of the area. The classification achieved an overall accuracy of 75% with a Kappa coefficient of 0.80.
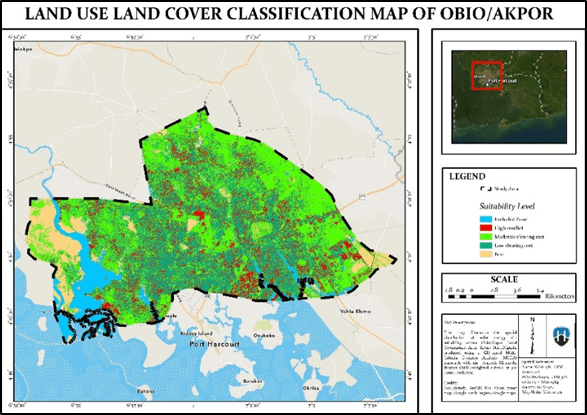
Figure 3.3: A map showing the land use land cover classification of the study area
Source: Authors’ Compilation, ArcGIS Pro, 2026
3.2.3 Proximity to Roads
Road accessibility is crucial in solar power plant installation, construction, maintenance, and dismantling. Because the transportation of materials required for building a solar power plant is expensive, the potential sites must be close to roadways. Locations with a proximity value of fewer than 1000 meters are suitable for the installation of solar power plants, whereas areas with a distance of more than 4000 meters are unsuitable. Euclidean Distance raster for roads was generated using the Euclidean Distance tool in ArcGIS Pro (Spatial Analyst > Distance). Road data from OpenStreetMap were filtered to include primary, secondary, tertiary, and residential classes. The dataset was reprojected to WGS 1984 UTM Zone 32N to ensure accurate distance measurement. The analysis used a 30 m cell size with the planar distance method.
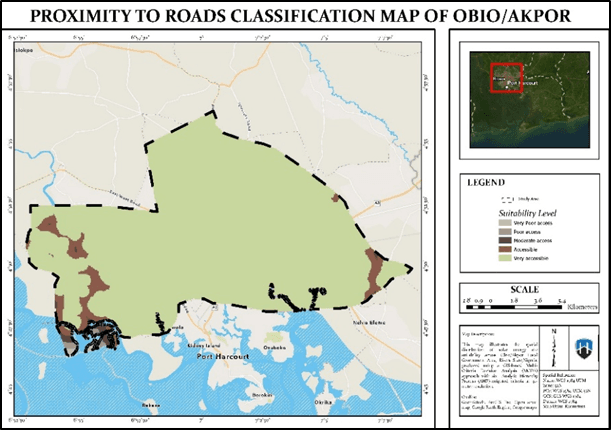
Figure 3.4: Map showing road proximity classification across the study area.
Source: Authors’ Compilation, ArcGIS Pro, 2026
3.2.4 Proximity to Buildings
Proximity to buildings is an important factor in solar site selection, as installations are generally preferred away from densely populated areas to minimize land-use conflicts and shading effects. Building proximity was derived by generating a Euclidean Distance raster from building footprint data sourced from OpenStreetMap (Geofabrik extract). The dataset was reprojected to UTM Zone 32N before analysis, with a 30 m cell size and planar distance method applied. Results show that many areas within the urban core have low suitability (score 1) due to their close proximity to residential structures, reflecting high building density and limited space for solar installations, while area less than 500m away from the urban core have high solar suitability with a score of 5.
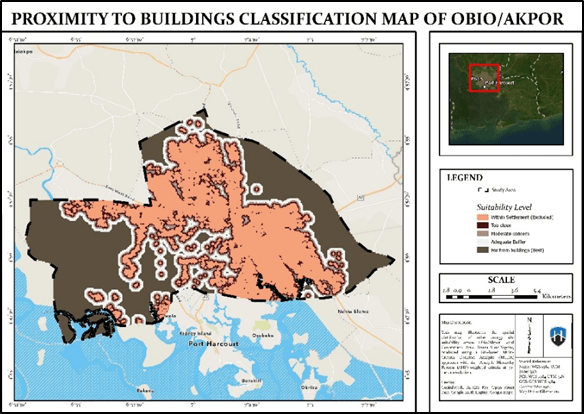
Figure 3.5: Map showing building proximity classification across the study area.
Source: Authors’ Compilation, ArcGIS Pro, 2026
3.2.5 Proximity to Railway
Proximity to railway infrastructure can support the transportation of equipment and materials for large-scale solar projects, although its influence is generally less significant compared to road accessibility. Railway distance was calculated using the Euclidean Distance tool in ArcGIS Pro. Railway line data obtained from the Geofabrik Nigeria dataset were used without modification and reprojected to UTM Zone 32N, with distances computed at a 30 m resolution across the study area. Results show generally low suitability scores due to the limited railway network in Rivers State, with large areas—especially in the northern part of the LGA—falling within lower suitability classes (1–2).
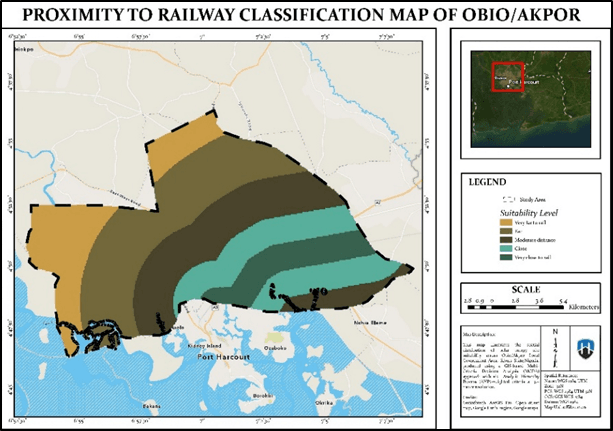
Figure 3.6: Map showing railway proximity classification across the study area.
Source: Authors’ Compilation, ArcGIS Pro, 2026
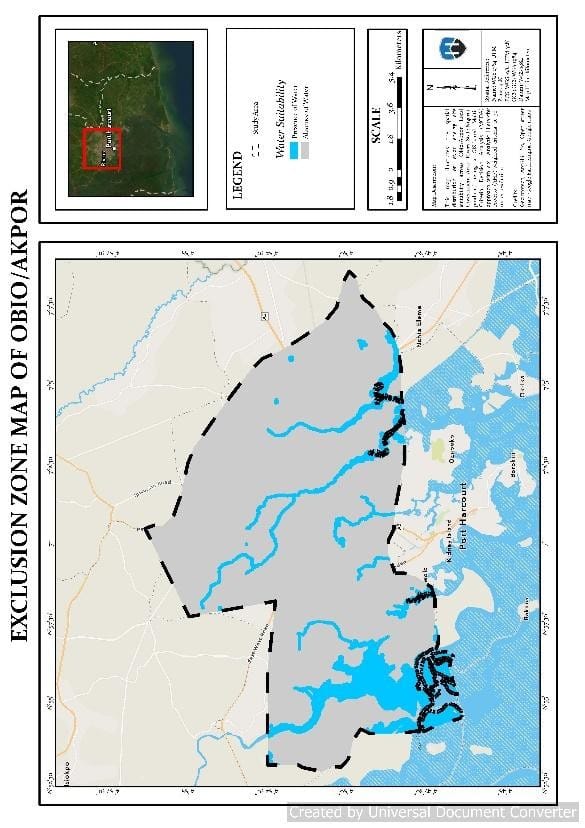
3.3 Exclusion Zone
Exclusion zones represent areas unsuitable for solar energy development due to environmental and physical constraints. In this study, water bodies and their surrounding buffer zones were excluded to reduce flood risk and protect sensitive ecosystems.
Water bodies and waterways were extracted from OpenStreetMap polygon and line layers. Both were buffered by 100 m using the Buffer tool in ArcGIS Pro to define a safe setback distance for solar infrastructure. The buffered layers were merged and converted into a raster, then transformed into a binary mask using the Raster Calculator expression:
Con(IsNull(“water_exclusion_raster”), 1, 0)
(where 0 = excluded areas and 1 = suitable areas).
This exclusion mask was applied to the final suitability map by multiplication after the weighted overlay analysis, ensuring that all restricted zones were removed from the final solar site selection.
3.4 Final Suitability Map and Classification
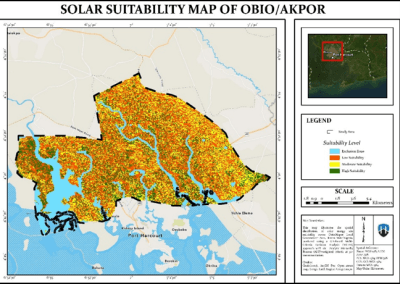
The weighted overlay produced a suitability index ranging from 2 to 5 across the study area, reflecting the predominance of moderate-to-high quality sites and the absence of extremely poor sites, consistent with the flat terrain and accessible road network of Obio/Akpor LGA. Following application of the water exclusion mask, the final suitability output was classified into four categories as presented in Table 2.
Table 2:
| Suitability Class | Index Range | Area (km²) | % of Study Area | Map Colour | |
| High Suitability | 4 – 5 | ~88 | 34% | Dark Green | |
| Moderate Suitability | 3 – 4 | ~107 | 41% | Yellow | |
| Low Suitability | 1 – 3 | ~47 | 18% | Red-Orange | |
| Excluded (Water Zone) | 0 | ~18 | 7% | Blue | |
| Total Study Area | – | ~260 | 100% | – | |
High suitability zones (score 4-5), covering approximately 88 km², are concentrated in the northern and northeastern peri-urban zones of the LGA, corresponding to areas of open bare land and sparse vegetation with flat terrain, good road access, adequate setback from buildings, and favourable solar irradiance. These zones represent the primary candidate areas for solar energy deployment and should be prioritised in any future renewable energy development plan for the area.
Moderate suitability zones (score 3-4) form a transitional belt around the urban fringe, where constraints related to land use type, building proximity, or reduced accessibility partially limit solar development potential. These areas may be viable for smaller-scale rooftop or distributed solar installations and warrant further site-specific investigation.
Low suitability zones (score 2-3) correspond primarily to the densely built-up urban core of Port Harcourt city within the LGA, where high building density, unfavorable LULC classification, and minimal setback from residential structures collectively reduce suitability. Water exclusion zones (value 0) are distributed across the southern portion of the LGA, consistent with the tidal creek network of the Niger Delta.
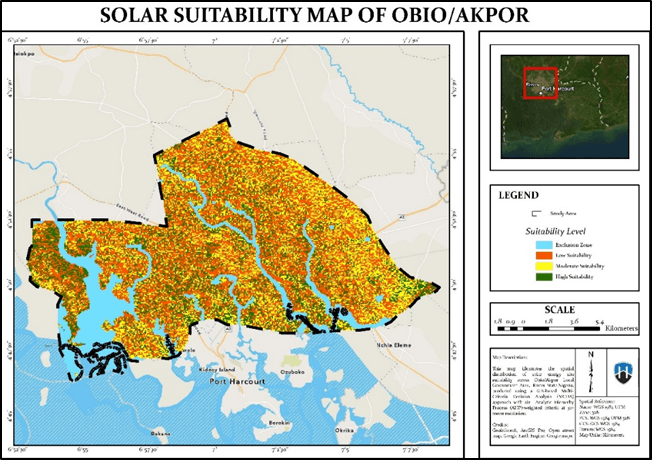
Figure 3.7: A map showing the exclusion zones of the Niger Delta.
Source: Authors’ Compilation, ArcGIS Pro, 2026
- CONCLUSION AND RECOMMENDATION
4.1 Conclusion
This study has successfully delivered a comprehensive geospatial assessment of solar energy site suitability across Obio/Akpor LGA, Port Harcourt, integrating drone and satellite data within a GIS-MCDA framework. The application of the Analytic Hierarchy Process to derive criterion weights, validated by a Consistency Ratio of 0.047, ensures that the spatial outputs are methodologically robust and suitable for citation in policy and planning contexts. The final suitability map clearly delineates high, moderate, and low suitability zones, with the northern peri-urban areas of the LGA identified as the most promising candidates for solar energy development.
The study demonstrates that the Niger Delta context, characterised by flat terrain, extensive creek networks, and mixed land use, presents both opportunities and constraints for solar siting that cannot be adequately captured by coarser national-scale assessments. The integration of OpenStreetMap infrastructure data, ERA5 solar radiation, Sentinel-2 LULC classification, and drone-derived terrain data within a unified MCDA framework provides a transferable methodological template for solar siting assessments in other Nigerian urban and peri-urban contexts.
4.2 Recommendations
Based on the findings of this study, the following recommendations are made:
- Priority solar development should be directed towards the northern and northeastern zones of Obio/Akpor LGA, where high suitability scores reflect the optimal combination of solar irradiance, open land, flat terrain, and road accessibility.
- State and local government energy agencies should conduct ground-truthing and detailed feasibility studies in the identified high-suitability zones to verify site conditions, land ownership, and grid connection potential.
- The binary water exclusion approach applied in this study should be adopted as a standard pre-processing step in all solar siting assessments in the Niger Delta region, given the demonstrated sensitivity of results to the inclusion or exclusion of tidal and creek buffer zones.
- Future studies should incorporate proximity to existing electrical substations and transmission lines as an additional criterion, given the significant cost implications of grid connection for solar installations.
REFERENCES
Aliyu, A. S., Ramli, A. T. and Saleh, M. A. (2015). Nigeria electricity crisis: Power generation capacity expansion and environmental ramifications. Energy, 61, pp. 354-367.
Ohunakin, O. S., Adaramola, M. S., Oyewola, O. M. and Fagbenle, R. O. (2013). Solar energy applications and development in Nigeria: Drivers and barriers. Renewable and Sustainable Energy Reviews, 32, pp. 294-301.
Najafi, G.; Ghobadian, B.; Mamat, R.; Yusaf, T.; Azmi, W.H. Solar energy in Iran: Current state and outlook. Renew. Sustain. Energy Rev. 2015, 49, 931–942.
Rizza T. Loquias, N. Ann, P. Mary Valerie, N. Magno, S.Compuesto, M. Zagada, DR Isaac, R. Tabal | H. JanTerano (2022). Suitability Mapping of Solar Energy Potential of Selected Areas in Camarines Sur using ArcGIS. (2022). In Camarines Sur [Journal-article]. https://doi.org/10.52631/jemds.v1i1.185
United Nations. Adoption of the Paris Agreement. In Proceedings of the Conference of the Parties,Twenty-First Session, Paris, France, 30 November–11 December 2015.
Salihu, M. K., Danladi, A., & Medugu, D. W. (2024). Regional-based potential assessment for solar photovoltaic generation in northern part of Nigeria using satellite imagery data. Bulletin of the National Research Centre/Bulletin of the National Research Center, 48(1). https://doi.org/10.1186/s42269-024-01291-2
E.C.X. Ikejemba, P.C. Schuur, J. Van Hillegersberg, P.B. Mpuan, Failures & generic recommendations towards the sustainable management of renewable energy projects in Sub-Saharan Africa (Part 2 of 2), Renew. Energy. 113 (2017) 639–647, doi:10.1016/j.renene.2017.06.002
- Hammer, D. Heinemann, C. Hoyer, R. Kuhlemann, E. Lorenz, R. Müller, H.G. Beyer, Solar energy assessment using remote sensing technologies, Remote Sens. Environ. 86 (2003) 423–432, doi:10.1016/S0034-4257(03)00083-X
- Huang, Z. Li, X. Li, S. Liang, K. Yang, D. Wang, Y. Zhang, Estimating surface solar irradiance from satellites: Past, present, and future perspectives, Remote Sens. Environ. 233 (2019)
Sanchez-Lozano, J. M., Teruel-Solano, J., Soto-Elvira, P. L. and Garcia-Cascales, M. S. (2013). Geographical Information Systems (GIS) and multi-criteria decision making (MCDM) methods for the evaluation of solar farms locations: Case study in south-eastern Spain. Renewable and Sustainable Energy Reviews, 24, pp. 544-556
Janke, J. R. (2010). Multicriteria GIS modeling of wind and solar farms in Colorado. Renewable Energy, 35(10), pp. 2228-2234.
Doorga, J. R. S., Rughooputh, S. D. D. V. and Boojhawon, R. (2019). Multi-criteria GIS-based land suitability mapping for solar farms in Mauritius. Renewable Energy, 133, pp. 1201-1219.
Raza, M. A., Yousif, M., Hassan, M., Numan, M., & Kazmi, S. A. A. (2023). Site suitability for solar and wind energy in developing countries using combination of GIS-AHP: A case study of Pakistan. Renewable Energy, 206, 180–191. https://doi.org/10.1016/j.renene.2023.02.010
Sari, D. K., Putra, A. D., & Yulianto, F. (2023). Mapping solar energy potential based on Google Earth Engine in West Sumatra Province. Journal of Applied Remote Sensing and GIS, 12(2), 45–58.
- Akinosun, Solar energy: Nigeria’s best shot at eradicating its electricity problem., (2017). https://techpoint.africa/2017/09/06/solar-energy-nigerias-eradicating-electricity-problem/
Adelakun, A. A., & Olanipekun, A. O. (2019). A review of solar energy development in Nigeria: Status and prospects. Renewable Energy Journal, 34(2), 112–124.
National Population Commission (NPC). (2006). Population and housing census of the Federal Republic of Nigeria. Abuja, Nigeria.
Nigerian Meteorological Agency (NiMet). (2020). Climate review bulletin. Abuja, Nigeria.
Obaideen, K., Olabi, A. G., Al Swailmeen, Y., Shehata, N., Abdelkareem, M. A., Alami, A. H., Rodriguez, C., & Sayed, E. T. (2023). Solar energy: Applications, trends analysis, bibliometric analysis and research contribution to sustainable development goals (SDGs). Sustainability, 15(2), 1418. https://doi.org/10.3390/su15021418
Mansouri Kouhestani, S., Byrne, J., & Taylor, M. (2018). Technical and economic assessment of solar rooftop potential. International Journal of Energy and Environmental Engineering, 9(3), 201–215. https://doi.org/10.1007/s40095-018-0289-1