Survey activities required for M&E Dashboard for Smart City
Survey activities required for M&E Dashboard for Smart City
1. RECONNAISSANCE SURVEY FOR TOWN PLANNING
Reconnaissance Survey is essential for screening through a survey that can be systematic or non-systematic in nature and involves physically walking through a stand to visually note and record characteristics found in the stand and results in a next action recommendation.
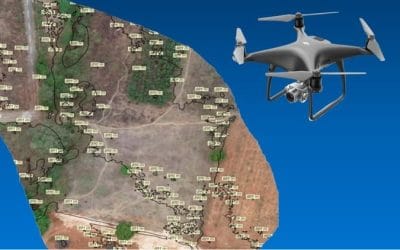
This is necessary to observe the surroundings within the project area, to be used during the survey. Eg. Observing the tallest buildings or feature (mast) that might hinder the progress of a drone survey, observing the location of restricted zones (military, barracks, government house), and visually noting down, threats, and nature of the environment so as to properly plan for the survey
1.1 Preparation for Site Reconnaissance:
To achieve effective and fruitful site reconnaissance, it is important to conduct preparation such as gathering of available information and devising a sufficient plan and schedule of survey activities in advance.
1.2 Information gathering and preparation
- 1/50,000 topographic maps
- Route maps enlarged by 200 to 400%
- Site conditions
- Coordinate with local officials
1.3 Necessary data/maps for preliminary site reconnaissance
- Route map
- Topographic map
- Geological map
- Aerial photograph
2. SURVEYS / ACTIVITIES NECESSARY FOR A GEODATABASE MANAGEMENT SYSTEM AFTER RECONNAISSANCE SURVEY
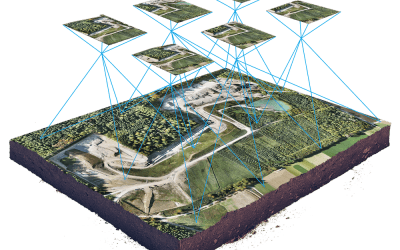
- Lidar Aerial Survey (Orthophoto, DTM, DEM, Contour)
- Perimeter Survey
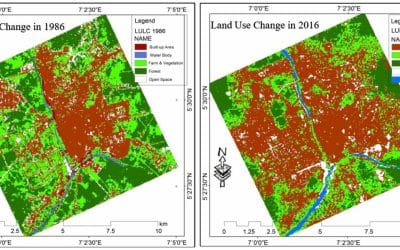
- Land use and Land Cover Classification
- Soil Survey
- Existing Building footprints
- Road layout and other Layout Plan/Master Plan
- Database schema
- Geodatabase Conceptual, Physical and Logical Plan

3. GIS FOR CADASTRE MANAGEMENT MONITORING AND EVALUATION DASHBOARD FOR SMART CITY
GIS Dashboards enable users to convey information by presenting location-based analytics using intuitive and interactive data visualizations on a single screen. Every user accessing the GIS platform can take advantage of these Dashboards to help make decisions, visualize trends, monitor status in real-time, and inform their communities. Tailor dashboards to your audiences, giving them the ability to slice the data to get the answers they need. Dashboards are essential information products, like maps and apps, providing a critical component to your geospatial infrastructure.
3.1 Why ArcGIS Dashboards?
- Easy to understand
- Ready to use
- Interactive
- Flexible
- Configurable
3.2 MONIROTING DATA/MAPS:
From data processing to cartography, the automated workflow is modeled and carried out in GIS to improve accuracy and quality and to save labor, time, and money. Visualize/observe at a glance all-in-one information within a project area (topography, soil, flood zone, masterplan, etc)
- Cadastral Maps (Map Added to Cadastral Layer and Annotated PIN Assigned)
- Ownership Register/records (Name, Phone no, Email, etc.)
- Valuation Data (Valuation Value of Land and Improvements Established)
- Survey Control
- High-Resolution Imagery
- Topography
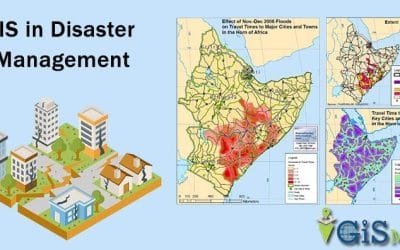
- Flood modeling
- Water flow/accumulation
- Total land completed/allocated
- Building status
- Affected/altered areas
- Master plan overlay
- Population status
- Land / property formation
- Security Status
- Monitoring of activities/changes within the project area