Introduction
In the previous post, we successfully loaded and visualized spatial data in QGIS. Now, it’s time to explore one of the core building blocks of any GIS project — vector data.
Whether you’re mapping cities, drawing roads, or analyzing boundaries, understanding vector layers is essential. In this post, we’ll cover what vector data is, the types commonly used, and how to interact with and edit vector layers directly in QGIS.
What is Vector Data?
Vector data represents the real world using three basic shapes:
- Points (e.g., schools, trees, ATMs)
- Lines (e.g., roads, rivers, pipelines)
- Polygons (e.g., administrative boundaries, land use areas)
Each shape is stored with attributes such as names, numbers, or descriptions that allow analysis and visualization.
Types of Vector Data Formats in QGIS
QGIS supports various vector data formats. Some of the most commonly used include:
- Shapefile (.shp) – A widely used GIS format (comes with multiple support files)
- GeoJSON (.geojson) – A web-friendly format, great for sharing
- SpatiaLite (.sqlite) – A lightweight spatial database
- Temporary Scratch Layers – Good for testing or drawing on the fly
Tip: Most vector files can be added to QGIS via the Browser Panel or Layer > Add Layer > Add Vector Layer.
What Are Vector Attributes?
Every vector feature (point, line, or polygon) usually comes with attribute data information stored in a table that describes each feature. For example:
- A polygon of a Nigerian state may include fields like State Name, Population, or Area_km2.
- A point representing a school may have attributes like Name, Type, Capacity.
These attributes are stored in an Attribute Table, which you can open, view, and even edit.
Adding a Vector Data Layer and Exploring Its Attributes
Once QGIS is set up and running, the next step is to load your vector data such as a shapefile and see the information it contains.
Step 1: Add a Vector Layer to QGIS
If your vector data (like a .shp file) is stored in your documents folder:
- Use the Browser Panel on the left side of QGIS.
- If your folder isn’t visible, right-click inside the panel and choose “Add Directory…” to connect to your Documents folder.
- Navigate to your shapefile, and double-click to load it.

You should now see the layer displayed on the map canvas. The arrow shows the .shp file format
Step 2: Open the Attribute Table
To see the data attached to each feature:
- Right-click the layer name in the Layers panel.
- Choose “Open Attribute Table.”

This shows all the attribute data stored in the layer like latitude, longitude, or any other fields.
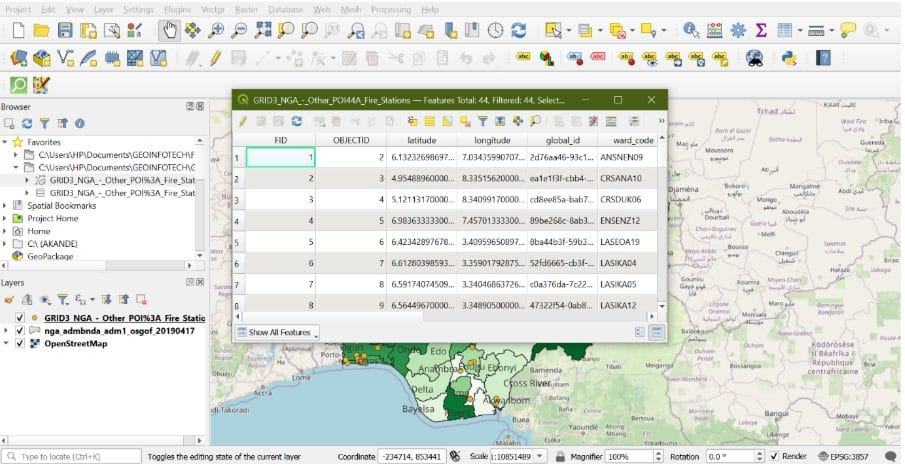
The attribute table lets you understand and interact with your spatial data. Every row represents a feature on the map, and every column gives you more context about it.
Symbolizing and Classifying Vector Data
For this blogpost, we will using the point vector data as reference. Now that the layer is loaded and its data explored, it’s time to visualize it meaningfully.
Let’s say you want to:
- Differentiate stations by type (central, satellite, mobile)
- Show the size of each station based on staff count
The first step:
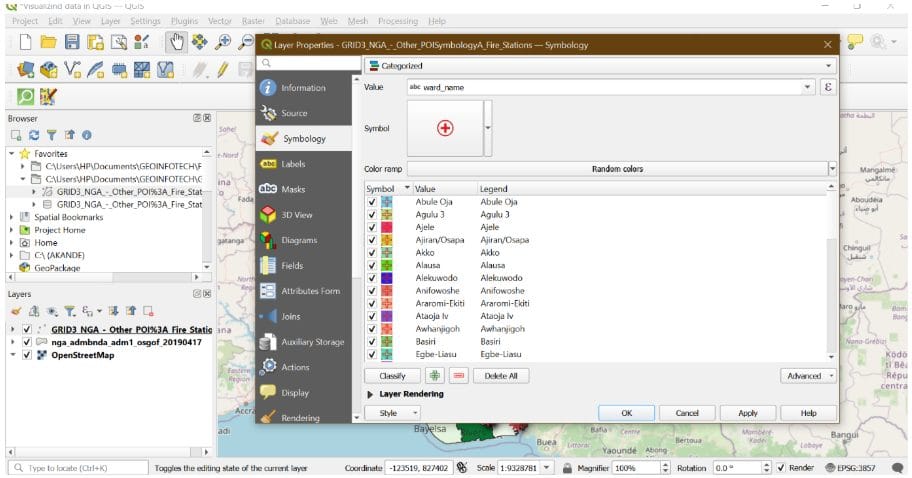
- Right-click the fire station layer → click “Properties” → Go to the “Symbology” tab → Choose one of the following: (Categorized or Graduated )
- Choose your classification field → Click “Classify” to generate the categories or ranges
- Customize colors, shapes, or sizes → Click OK to apply the style
- Add Labels: Go to Properties > Labels > Choose the name field (e.g., Station_Name)
- Save Your Work → File > Save
In this part of the series, you’ve learned how to:
- Add point-based vector data
- Explore feature attributes
- Classify and style your map for better communication
In our next post, we’ll begin working with digitizing and georeferencing, helping you map features from scratch or align scanned maps with real-world coordinates.