Geographic Information Systems (GIS) have become invaluable tools in bathymetry and hydrography, offering advanced techniques for mapping, analyzing, and managing water bodies. Bathymetry deals with the measurement of underwater depths, while hydrography involves studying water bodies’ physical features, including the seabed and hydrodynamic conditions. The integration of GIS in these domains has transformed the way we understand and utilize marine and freshwater environments, enabling more effective management and resource conservation. Here are some real-world examples of GIS applications in bathymetry and hydrography.
Bathymetric Mapping and Visualization
Real-World Example: NOAA’s Bathymetric Mapping Project (USA)
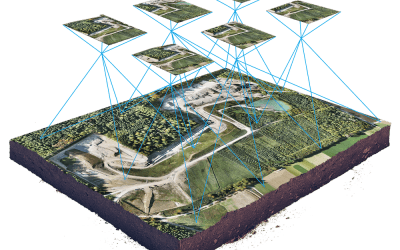
The National Oceanic and Atmospheric Administration (NOAA) uses GIS extensively for bathymetric mapping along the U.S. coastlines. Using sonar data, satellites, and remote sensing technology, NOAA generates high-resolution digital elevation models (DEMs) of the ocean floor. GIS software, like Esri ArcGIS, is used to integrate these datasets, visualize underwater topography, and create navigational charts that are critical for marine transportation and coastal management.
Applications:
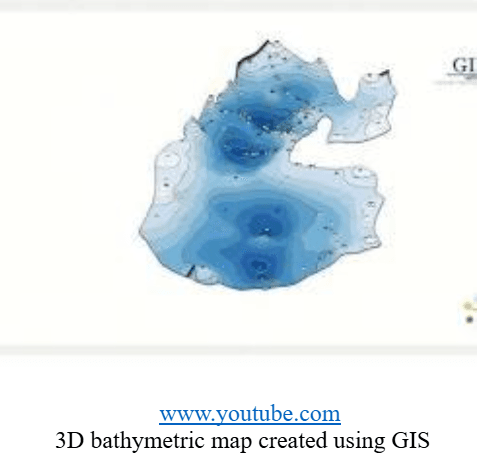
- Creation of detailed 3D models of the seabed.
- Integration of bathymetric data with tidal, weather, and shipping data to enhance maritime navigation safety.
- Mapping deep-sea habitats, such as hydrothermal vents and coral reefs, to assess biodiversity and manage marine protected areas (MPAs).
Coastal Zone Management
Real-World Example: Coastal Erosion and Flood Risk Mapping in New Orleans (USA)
GIS plays a crucial role in understanding coastal erosion and flood risks, especially in vulnerable regions like New Orleans. The city, located below sea level, faces significant challenges related to storm surges, hurricanes, and flooding. By combining bathymetric data with hydrodynamic models and tidal data, GIS is used to simulate flood scenarios and inform urban planning decisions.
Applications:
- Flood Modeling: GIS helps predict areas at risk of flooding by analyzing the relationship between bathymetry, land elevation, and storm surge models.
- Coastal Protection Plans: It enables the planning of flood protection measures, such as levees, sea walls, and tidal gates, by assessing the vulnerability of the coastline to erosion and rising sea levels.
Marine Navigation and Safety
Real-World Example: UK Hydrographic Office and Admiralty Charts
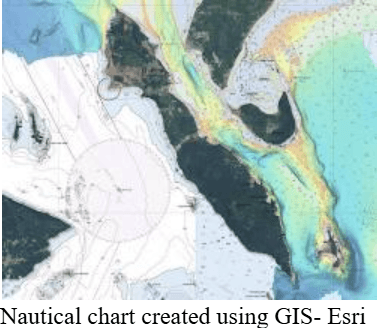
The United Kingdom Hydrographic Office (UKHO) provides navigational charts used globally by mariners through the Admiralty product line. These charts incorporate bathymetric data, tide tables, and hydrographic surveys into GIS for dynamic, real-time navigation updates. The data supports the development of nautical charts, which provide critical information about water depths, submerged obstacles, and safe navigation routes for ships.
Applications:
- Real-time Updates for Navigation: As maritime traffic increases, integrating bathymetric data with real-time tide and current data allows for safer, up-to-date navigation information.
- Automated Chart Updates: GIS technologies are used to continually update navigational charts, ensuring that they reflect changes in bathymetric features, such as newly discovered reefs or shifting sandbanks.
Environmental Monitoring and Marine Ecology
Real-World Example: Coral Reef Monitoring in the Great Barrier Reef (Australia)
The Great Barrier Reef Marine Park Authority uses GIS for managing and monitoring the health of coral reefs. By integrating bathymetric data with satellite imagery, environmental sensors, and species distribution data, GIS provides insights into the condition of coral reefs and marine ecosystems. GIS tools are employed to track coral bleaching, sedimentation, and water quality changes, enabling better decision-making for conservation efforts.
Applications:
- Habitat Mapping: GIS helps identify and protect critical habitats such as coral reefs, mangroves, and seagrass beds by providing detailed spatial data on their distribution and health.
- Pollution Impact Studies: Bathymetric and hydrographic data are combined with pollution data (e.g., oil spills) to model the spread and impact of contaminants on marine ecosystems.
- Submarine Cable and Pipeline Routing
Real-World Example: Atlantic Ocean Cable Route Planning (International)
The planning and installation of submarine cables, such as those used for undersea internet connections between continents, rely heavily on GIS. Bathymetric data, along with information on the seabed composition, geological features, and potential hazards, are analyzed using GIS to identify optimal cable routes. One such example is the planning of the transatlantic fiber optic cables that link North America to Europe.
Applications:
- Route Optimization: GIS integrates bathymetric data with geological, ecological, and economic factors to determine the safest and most cost-effective routes for submarine cables.
- Risk Assessment: GIS models help avoid areas with underwater hazards like shipwrecks, deep-sea trenches, or tectonic fault lines that may disrupt the installation of cables.
Hydrodynamic Modeling and Water Quality Monitoring
Real-World Example: Chesapeake Bay Program (USA)
The Chesapeake Bay Program uses GIS to manage water quality and hydrodynamic modeling for the Chesapeake Bay. By combining bathymetric data with hydrodynamic simulations (e.g., currents, tides) and water quality measurements (e.g., nitrogen levels, salinity), GIS provides a tool to monitor and improve the bay’s ecosystem. The program has been instrumental in efforts to reduce nutrient pollution and restore the health of the bay.
Applications:
- Pollution Control: GIS is used to model the spread of pollutants like nitrogen and phosphorous, which contribute to harmful algal blooms, and develop strategies for pollution reduction.
- Water Quality Analysis: Integrating bathymetric data with water quality sensors allows for a comprehensive understanding of how changes in the environment affect aquatic ecosystems.
Seafloor and Subsea Exploration
Real-World Example: Oil and Gas Exploration in the North Sea (UK and Norway)
GIS is crucial for mapping and analyzing subsea features in the North Sea, an area rich in oil and gas reserves. Companies in the energy sector use GIS to combine bathymetric data with geological surveys to identify areas for potential drilling. These data layers help assess risks, optimize drilling locations, and ensure that infrastructure like pipelines and platforms are built in safe locations.
Applications:
- Seafloor Mapping for Drilling: Bathymetric data is used to avoid areas of rough seafloor terrain or underwater geological hazards during exploration and drilling activities.
- Pipeline Routing and Integrity: GIS helps in planning safe subsea pipeline routes and monitoring them for possible failures or vulnerabilities, based on bathymetric conditions and seabed movement.
Disaster Management and Tsunami Warning Systems
Real-World Example: Indian Ocean Tsunami Early Warning System (India, Indonesia, and other nations)
After the devastating 2004 Indian Ocean tsunami, GIS technologies were employed to develop an early warning system for future events. Bathymetric and hydrodynamic models are used to predict tsunami wave propagation and impact areas. GIS helps integrate real-time data from ocean buoys, tidal gauges, and seismic activity to provide warnings to vulnerable coastal communities.
Applications:
- Tsunami Modeling: GIS is used to simulate how tsunamis will propagate across the ocean, taking into account bathymetric features that can either amplify or dampen the waves.
- Evacuation Planning: GIS helps plan evacuation routes and prepare response measures by predicting which coastal areas are most at risk from tsunami waves.
Conclusion
GIS has revolutionized bathymetry and hydrography by enabling more accurate, efficient, and real-time data analysis for a wide range of applications. From marine navigation to environmental conservation and resource exploration, GIS provides the tools necessary for managing water bodies and ensuring their sustainable use. The real-world examples mentioned above demonstrate how GIS helps mitigate risks, optimize operations, and protect marine ecosystems, underscoring the importance of spatial data in today’s water resource management.