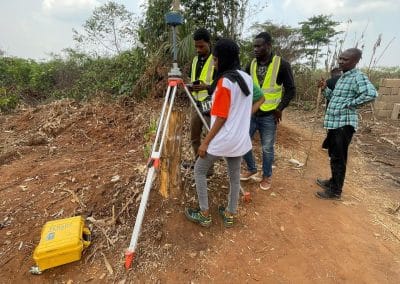
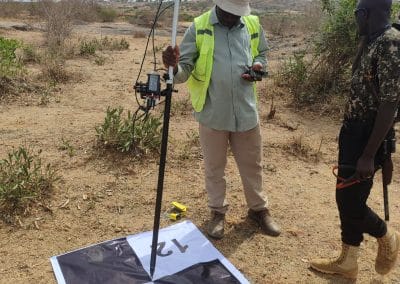
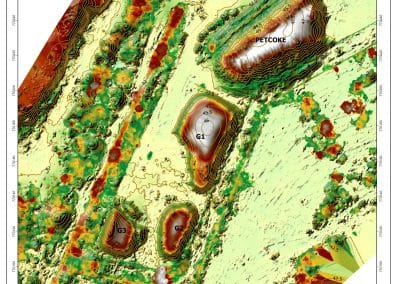
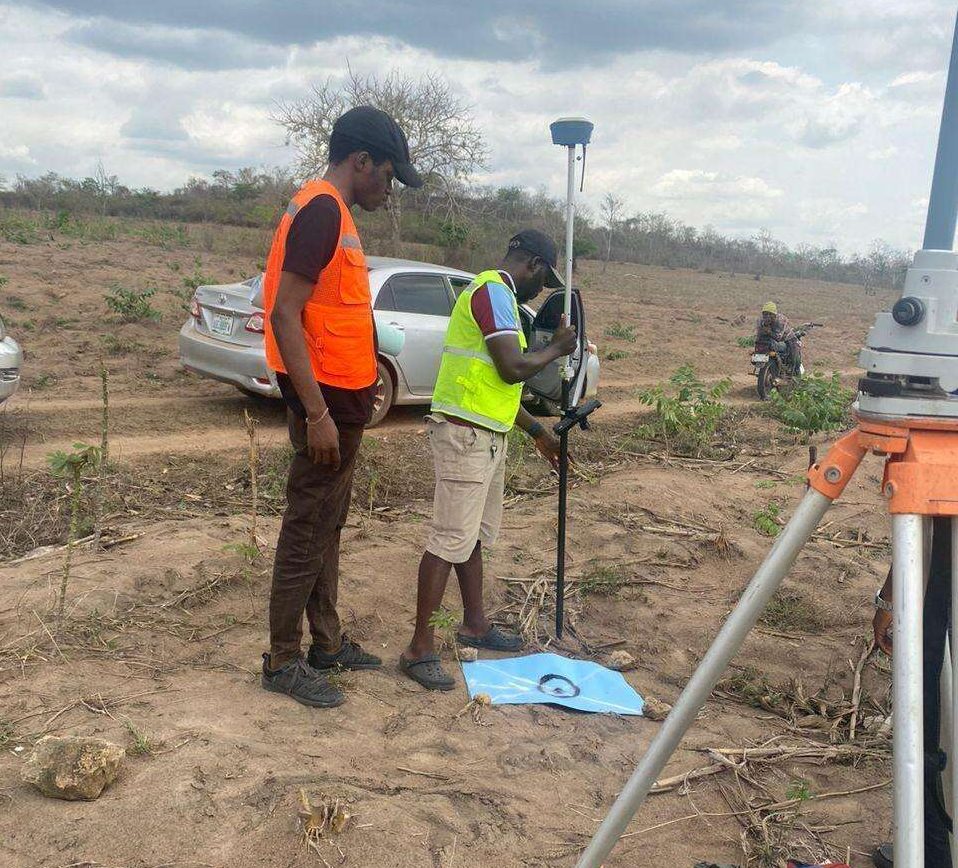
Geospatial data is the lifeblood of any GIS project, powering everything from urban planning to environmental monitoring. But here’s the catch: raw geospatial data is rarely pristine. Whether it’s missing coordinates, duplicate points, or inconsistent formats, dirty data can derail your analysis, skew your maps, and waste your time. Cleaning geospatial data isn’t glamorous, but it’s essential—and doing it right can mean the difference between a reliable map and a misleading mess.
Why Cleaning Geospatial Data Matters
Unlike tabular data, geospatial data combines spatial coordinates (e.g., latitude/longitude, X/Y values) with attributes (e.g., population, land use). Errors in either dimension—spatial or attribute—can cascade through your project. A missing point could omit a critical feature, duplicates might inflate your stats, and mismatched formats could misalign layers. Cleaning ensures your data is accurate, consistent, and ready for analysis. Here’s how to tackle three big culprits.
Pitfall 1: Missing Values
Missing data is a frequent headache in geospatial datasets—think unrecorded coordinates, blank attribute fields, or gaps from faulty sensors. Left unchecked, it can distort spatial patterns or break your analysis.
Techniques to Handle Missing Values
- Identify the Gaps
- Use GIS software (e.g., ArcGIS’s “Select by Attributes” or QGIS’s “Filter”) to find records with null or empty fields (e.g., Latitude IS NULL).
- For spatial gaps, visualize your data as a point layer—holes in the pattern often stand out.
- Tip: Export a summary (e.g., count of nulls per column) to quantify the problem.
- Fill with Inference
- Interpolation: For spatial data like elevation or temperature, use techniques like Inverse Distance Weighting (IDW) or Kriging to estimate missing values based on nearby points. In ArcGIS, try the “Spatial Analyst” tools; in QGIS, use the “Interpolation” plugin.
- Attribute Proxy: If a field like “population” is missing, infer it from related data (e.g., average population density in that area).
- Caution: Document your assumptions—interpolation isn’t magic and can introduce bias.
- Flag or Remove
- If missing values are few and non-critical (e.g., 2% of a large dataset), consider deleting those records. In QGIS, use “Delete Selected Features” after filtering.
- For critical gaps, flag them (add a “DataQuality” column with “Missing”) and address later with field collection or external sources.
Pitfall 2: Duplicates
Duplicate records—whether identical points or repeat attributes—can inflate counts, skew statistics, and clutter visualizations. In geospatial data, duplicates might arise from merging datasets, human error, or oversampling.
Techniques to Handle Duplicates
- Detect Duplicates
- Spatial Duplicates: In ArcGIS, use “Find Identical” (Data Management Tools) to spot points with matching X/Y coordinates. In QGIS, try the “Remove Duplicate Geometries” tool.
- Attribute Duplicates: Sort your table by key fields (e.g., “SensorID”) and look for repeats. Python scripts with pandas (e.g., df.duplicated()) work well for large datasets.
- Tip: Check both geometry and attributes—two points at the same spot might have different IDs.
- Resolve Duplicates
- Keep the Best: If duplicates have slight variations (e.g., one has more complete attributes), retain the most detailed record. Use “Dissolve” in ArcGIS with a “MAX” statistic to prioritize fuller data.
- Average or Aggregate: For overlapping points (e.g., repeated temperature readings), average the values and merge into one feature.
- Delete: If they’re truly redundant, remove extras with “Delete Identical” or a manual cull.
- Prevent Recurrence
- Standardize data entry (e.g., unique IDs) and validate merges to avoid reintroducing duplicates.
Pitfall 3: Inconsistent Formats
Inconsistent formats plague geospatial data—think “Lat” vs. “Latitude,” degrees in decimal vs. DMS (degrees-minutes-seconds), or mismatched projections. These mismatches can misalign layers or crash your tools.
Techniques to Handle Inconsistent Formats
- Standardize Field Names
- Rename columns to a consistent scheme (e.g., “Lat_DD,” “Long_DD”) using “Alter Field” in ArcGIS or “Refactor Fields” in QGIS.
- Tip: Create a data dictionary to enforce naming across projects.
- Normalize Coordinate Formats
- Convert DMS (e.g., 40°42’46.1″N) to decimal degrees (40.7128°) with a calculator or script (Python’s re module can parse these). GIS tools like ArcGIS’s “Convert Coordinate Notation” automate this.
- Ensure all coordinates use the same datum (e.g., WGS 84). Use “Define Projection” if the metadata’s wrong.
- Align Projections
- Check each layer’s coordinate system (right-click > Properties in ArcGIS/QGIS). If one’s in UTM and another’s in GCS, reproject them to match using “Project” (ArcGIS) or “Reproject Layer” (QGIS).
- Caution: Reprojecting introduces slight rounding—do it once and save the result.
- Fix Text and Units
- Standardize text (e.g., “Street” vs. “St.”) with “Find and Replace” or Python’s str.replace().
- Convert units (e.g., feet to meters) with a multiplier (1 ft = 0.3048 m) in a calculated field.
Conclusion
Cleaning geospatial data is like prepping a canvas—skip it, and your masterpiece won’t hold up. By tackling missing values with interpolation or flags, deduplicating with precision, and standardizing formats proactively, you’ll sidestep common pitfalls and set your GIS project up for success. At [Your Company Name], we’ve cleaned datasets from urban sprawls to remote wilderness—let us help you turn raw data into actionable insights. What’s your trickiest data cleaning challenge? Share it in the comments below!


