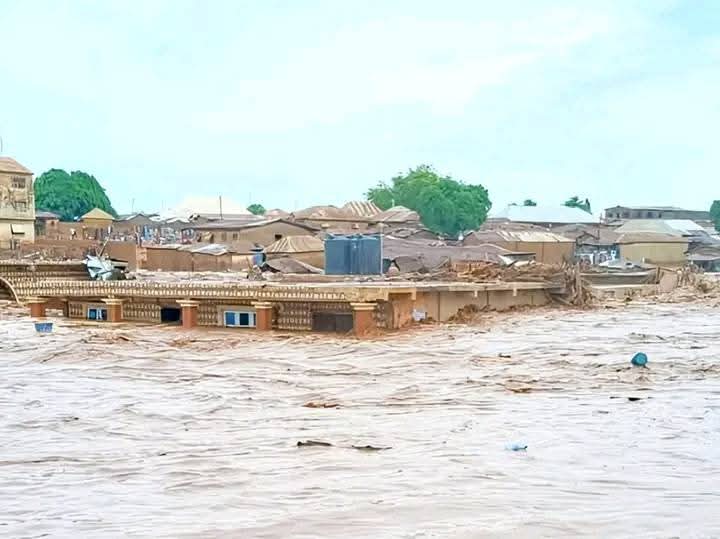
In May 2025, the town of Mokwa in Niger State, Nigeria, experienced one of the most catastrophic floods in the country’s recent history. Heavy rains, the collapse of a local dam, and rising river levels combined to devastate the region. Over 200 lives were lost, more than 3,000 homes were affected, and vital infrastructure was wiped out. While the human toll of such events is always heartbreaking, the unfolding disaster also underscored the critical role that geospatial technology, particularly GIS, plays in disaster preparedness, response, and recovery.
In this blog post, we explore how geospatial tools helped map the devastation, support emergency responders, and build resilience against future disasters.
Real-Time Mapping for Rapid Response
When the floodwaters surged into Mokwa’s low-lying neighborhoods, one of the first tools deployed by emergency teams was GIS. Satellite imagery, aerial drone data, and hydrological models were integrated in real-time to generate flood extent maps. These maps helped decision-makers visualize submerged areas, locate high-risk zones, and prioritize rescue operations where people were most vulnerable.
For example, platforms like NASA’s Flood Dashboard and the Copernicus Emergency Management Service provided satellite-derived flood maps within hours, helping guide local and international relief efforts on the ground
GIS-Based Damage Assessment
After the flood receded, geospatial analysts turned to post-disaster imagery to assess the scope of damage. High-resolution imagery was compared against pre-flood baselines using change detection analysis in software like QGIS and ArcGIS. The results were used to identify buildings destroyed, road networks affected, and agricultural land lost.
This spatial data was crucial for:
- Estimating the economic impact
- Filing insurance and disaster claims
- Guiding resource allocation for reconstruction
Supporting Communication and Relief Logistics
Using GIS web maps and mobile data collection tools (e.g., KoboToolbox, Survey123), volunteers and humanitarian workers were able to track the delivery of aid, update the locations of displaced individuals, and identify where medical and food supplies were most urgently needed.
By layering population density maps with flood extents and road accessibility, relief agencies optimized their delivery routes—especially to areas cut off by collapsed bridges or inundated roads.
Early Warning and Risk Modeling for Future Resilience.
The Mokwa disaster also reinforced the need for proactive risk mapping. Using hydrological modeling and digital elevation models (DEMs), GIS analysts are helping local governments create flood risk zones. These maps can be used to:
- Design effective evacuation plans
- Identify safe zones and resettlement areas
- Improve land use planning and urban drainage design
Tools like HEC-RAS and SWAT, combined with GIS layers such as land cover and rainfall intensity, are proving essential for building resilience before the next flood strikes.
Final Thoughts
The 2025 Mokwa floods were a tragic reminder of our growing vulnerability to climate-related disasters. But they also highlighted the transformative power of geospatial technology in saving lives and guiding effective responses. As floods, fires, and other natural hazards become more frequent, GIS will continue to be a central pillar in disaster management—from predicting the next risk to rebuilding stronger, smarter communities.
By investing in geospatial capacity and integrating GIS into disaster workflows, we can turn data into action when it matters most.
Do you work in disaster response or GIS? Share how geospatial tools have helped your community prepare for or recover from natural disasters.