Unlike 2D which provides a 2-Dimensional view (X, Y) indicating positions, 3D GIS shows or tells us more details about the object of interest as a result of the presence of a third variable Z. Z can represent a variety of attributes depending on its application. from height of a building, depth of the sea, floor number, thickness, mineral deposit, population density, crime rates, water depth, noise levels, soil moisture and so on. Its interpretation strictly depends on application.
What is 3D GIS?
Otherwise known as 3-Dimensional Geographic Information Systems, refers to the technology used to collect, store, analyze and visualize geospatial data in three dimensions, enabling the representation of complex and spatial relationships and phenomena. There are softwares that can be used for 3D visualization and Analysis namely: ArcGIS, QGIS, Google earth, Sketch up, Blender, Autodesk Civil 3d, Bentley Systems, Safe Software, etc.
3D Visualization in GIS
The process of representing geographic data in a three-dimensional environment, allowing users to interact, explore and analyze spatial relationships.
There are different types of 3D Visualizations they are 2.5D, 3D Vector, 3D raster, 3D Mesh.
- 2.5D: This is 2D data with height information used for terrain, elevation and DEM visualization. Examples are topographic maps, elevation profiles, and terrain models.
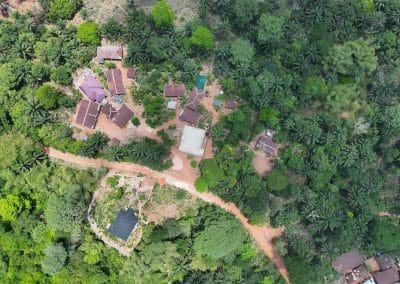
- 3D Vector are 3D models of objects (e.g. buildings, trees and infrastructures) used for urban planning and landscape design. Examples are Building information Modelling (BIM), 3D City models, Urban planning visualizations
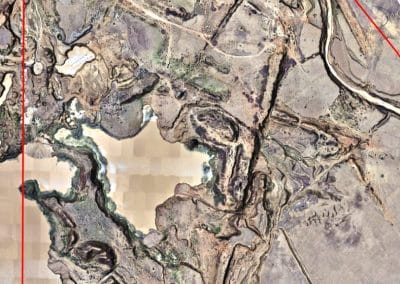
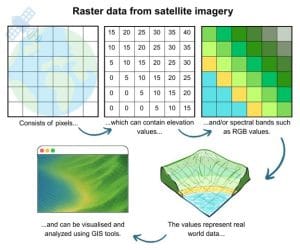
- 3D Raster are three-dimensional grid-based data i.e. 3D elevation models used for terrain analysis, hydrology and environmental modeling. Examples are 3D terrain models, Hydrological modelling, and Environmental impact assessments.
- 3D Mesh are polygon-based 3D models that supports rendering properties like textures, colors and transparency. They can be used to represent any type of data including buildings, vegetation, complex terrains, and Street furniture and building interior models. They are 3D models of complex objects (e.g. building, terrains) used for simulation, animation and gaming.

3D Analysis in GIS
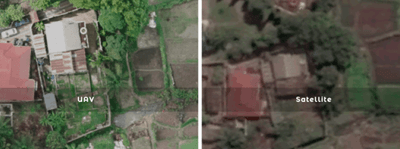
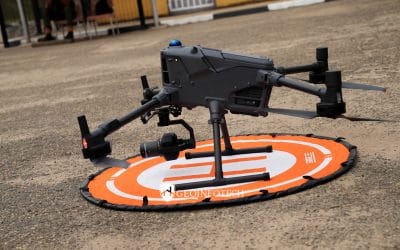
The process of using GIS software to analyze and visualize three dimensional data.it enables advanced spatial analysis and visualization.it can be used to identify patterns and trends, such as changes in land use over time or to model the potential impacts of natural hazards, such as floods and earthquake. It can be used to analyze remote sensing data such as LIDAR and Photogrammetry. This data is used to collect data about the shape and structure of the Earth’s surface and can be used to create 3D Models of cities, landscapes and other features. It can be applied in various fields such as urban planning, transportation and environmental management.
Some examples of 3D Analysis software are ArcGIS (Esri), QGIS 3D, Google Earth, Sketch Up, Autodesk Civil 3D.
Applications of 3D GIS Visualization and analysis.
- Geology and Mining for 3D geological modelling.
- Transportation planning: for 3D road network analysis.
- Emergency response: 3D Emergency planning and evacuation routes
- City planning.
- Costal modelling and Analysis.
- Building information Modelling (BIM)
- Utility vegetation Management
- Disaster response.
- Wind farm assessment
- Metropolis planning.
For more info: visit a 3D-modelling / 3D analysis with GIS – Geoinfotech