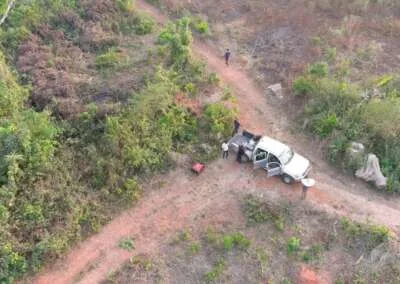
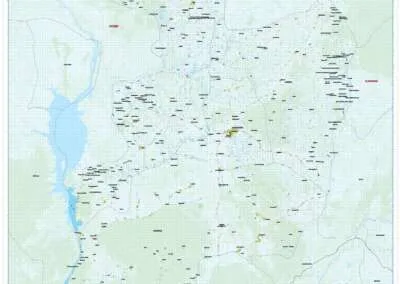
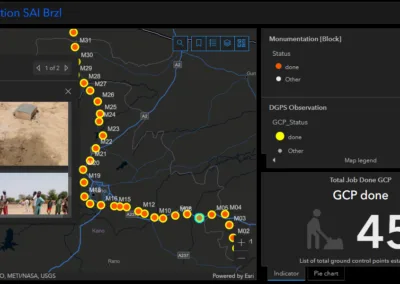
We pointed a radar satellite at every road in Lagos. 82,992 segments. 17,997 kilometres. All 20 LGAs. The results were not pretty.
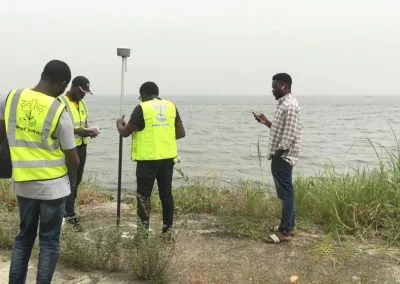
Somewhere in a Lagos State government office right now, someone is deciding which road gets fixed this quarter. They have a list. They have a budget that does not cover the whole list. And they almost certainly do not have satellite data. That is how Lagos road degradation mapping has worked for decades: guesswork dressed as planning. We decided to change that. Armed with a free radar satellite, Google Earth Engine, and a lot of computing patience, Geoinfotech mapped the risk level of every road in Lagos. Here is what we found.
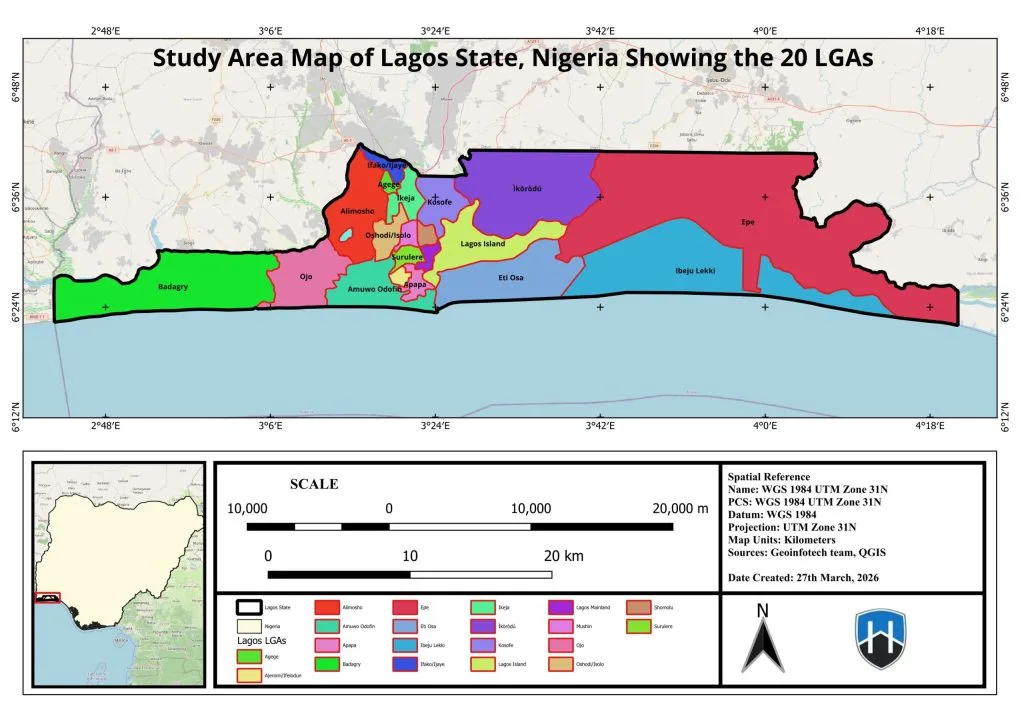
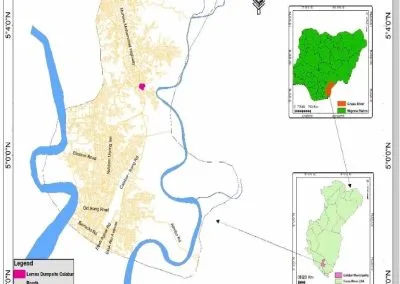
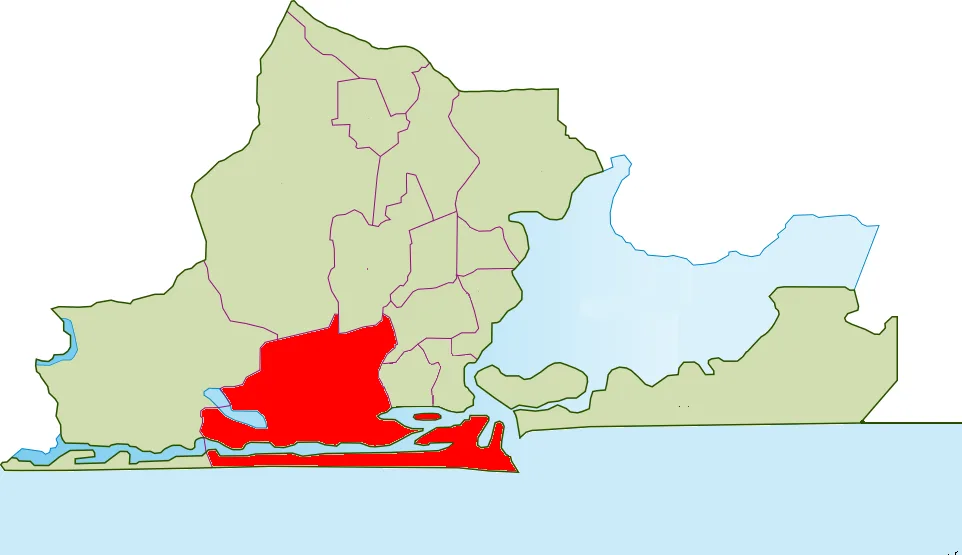
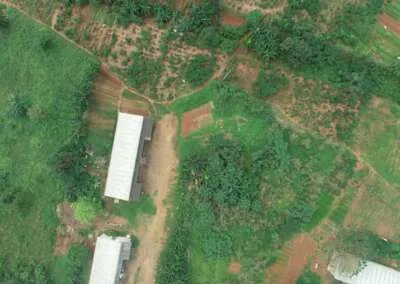
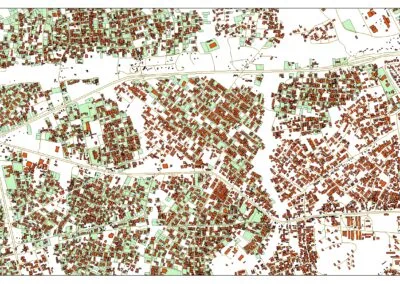
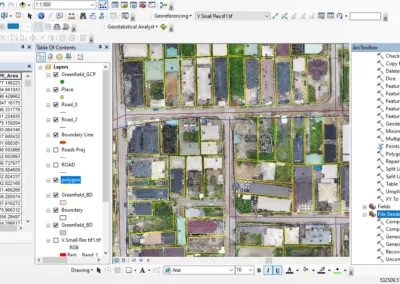
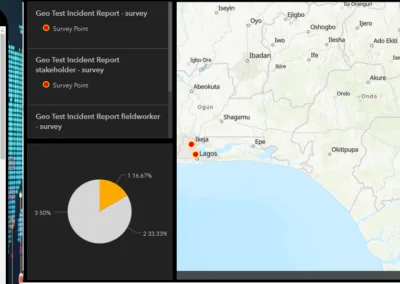
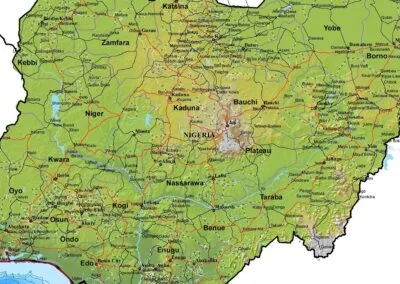
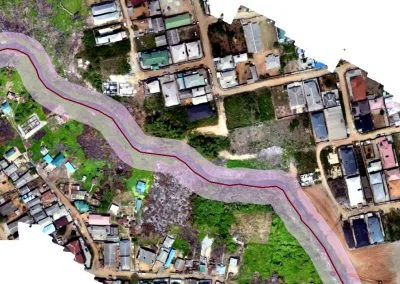
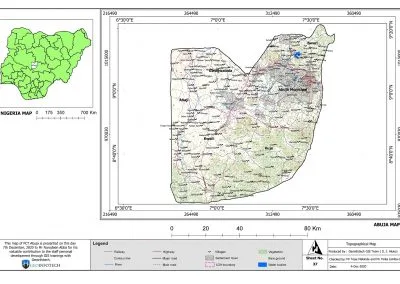
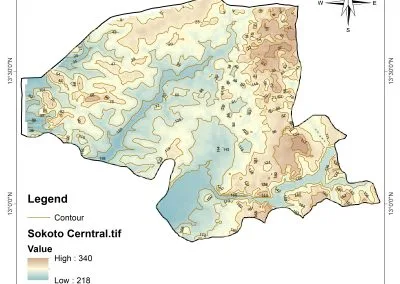
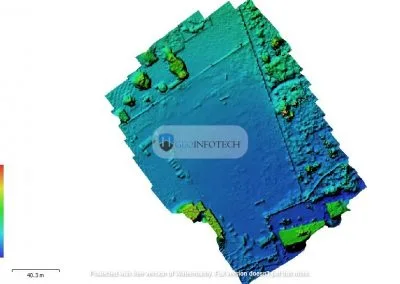
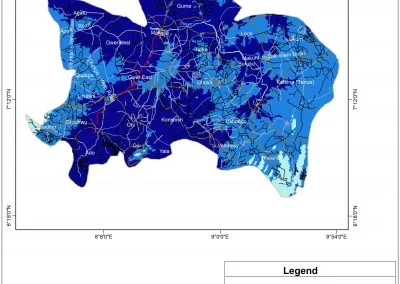
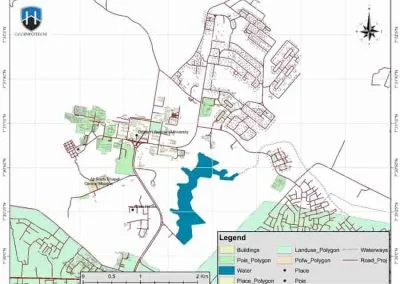
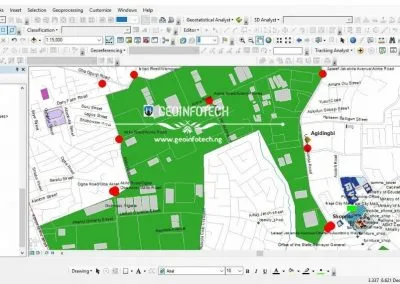
Figure1: Our Study Area Map of Lagos State, Nigeria Showing the 20 LGAs
Why Lagos Roads Are So Hard to Track
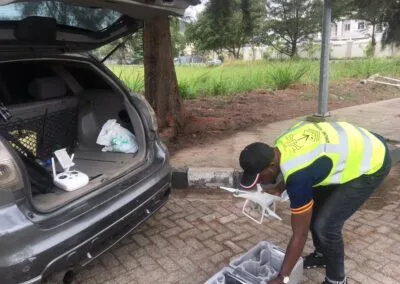
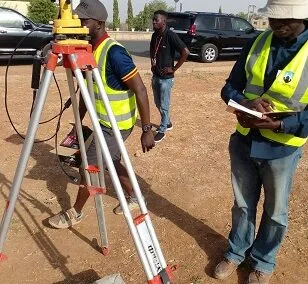
Lagos has 17,997 kilometres of road across 20 LGAs. Traditional road surveys, engineers driving around with measurement equipment, are slow, expensive, and always out of date by the time they finish. Furthermore, the wet season eats roads faster than any survey team can keep up.
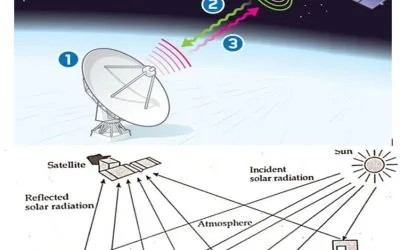
The result is a governance gap. Maintenance money goes to the loudest complaints, not the worst roads. We wanted to fix that. So we used Sentinel-1, a European Space Agency radar satellite that works through cloud cover, rain, and Lagos harmattan haze. It sees roads the way no ground team ever could.
How We Built the Lagos Road Degradation Map
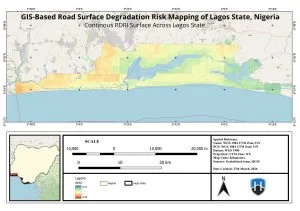
Our Lagos road degradation mapping approach combined five risk indicators, each weighted and overlaid to produce a single score per road segment, the Road Degradation Risk Index (RDRI).
- SAR Backscatter Change (30%): how much a road surface absorbs moisture between dry and wet seasons. High absorption means high stress.
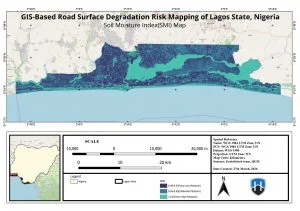
- Soil Moisture Index (25%): how wet the ground beneath the road gets. Wet subgrade equals weakened foundations.
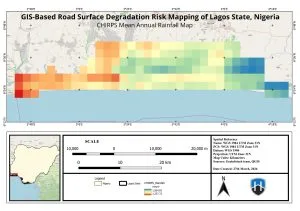
- Mean Annual Rainfall (20%): more rain means more cumulative stress over time.
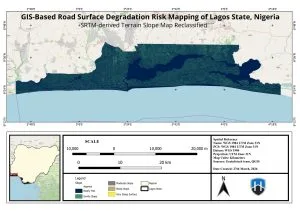
- Terrain Slope (15%): steeper ground means faster runoff and more shoulder erosion.
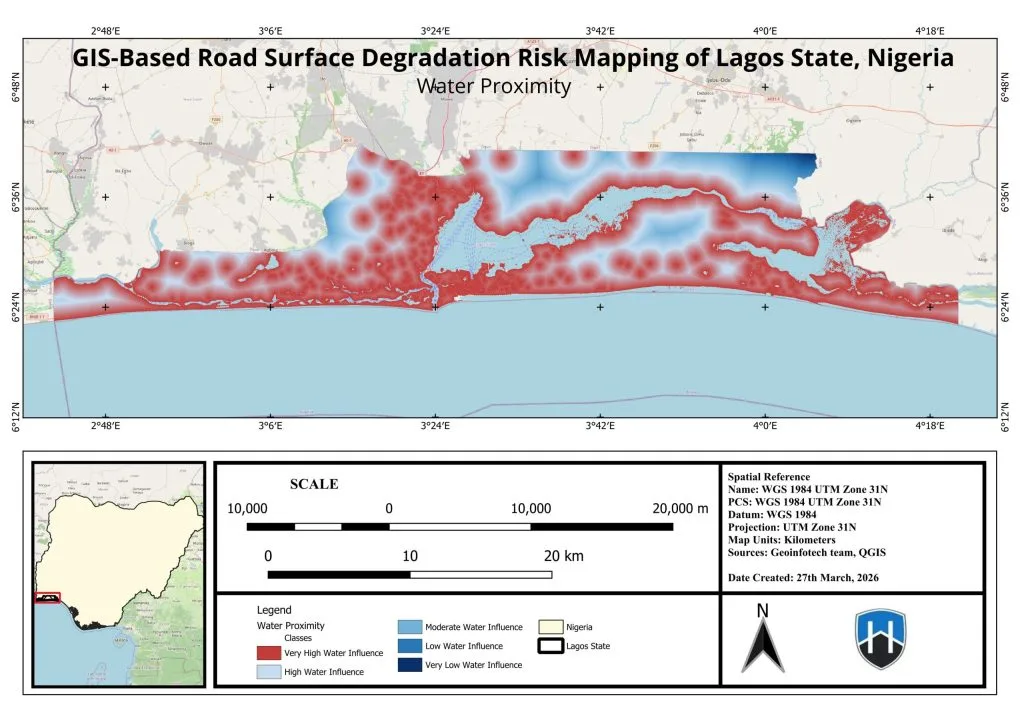
- Proximity to Water Bodies (10%): roads next to lagoons and creeks face seepage and inundation risk.
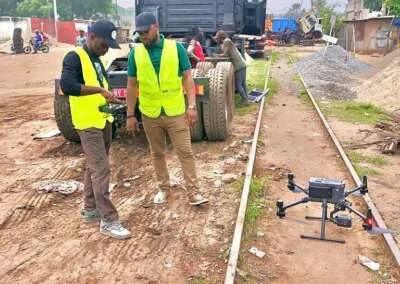
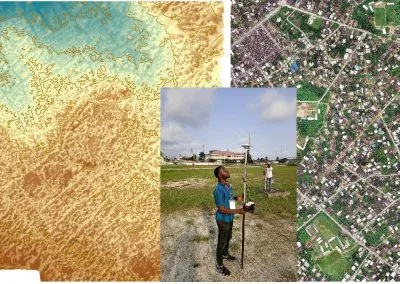
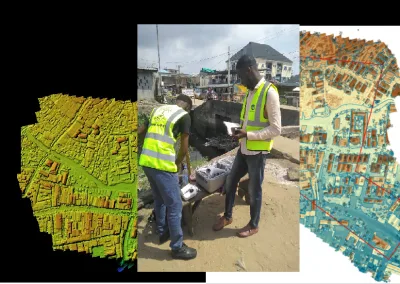
The whole pipeline ran in Google Earth Engine and QGIS, using only free, open-source tools and freely available satellite data. In other words, any Nigerian city could replicate this.
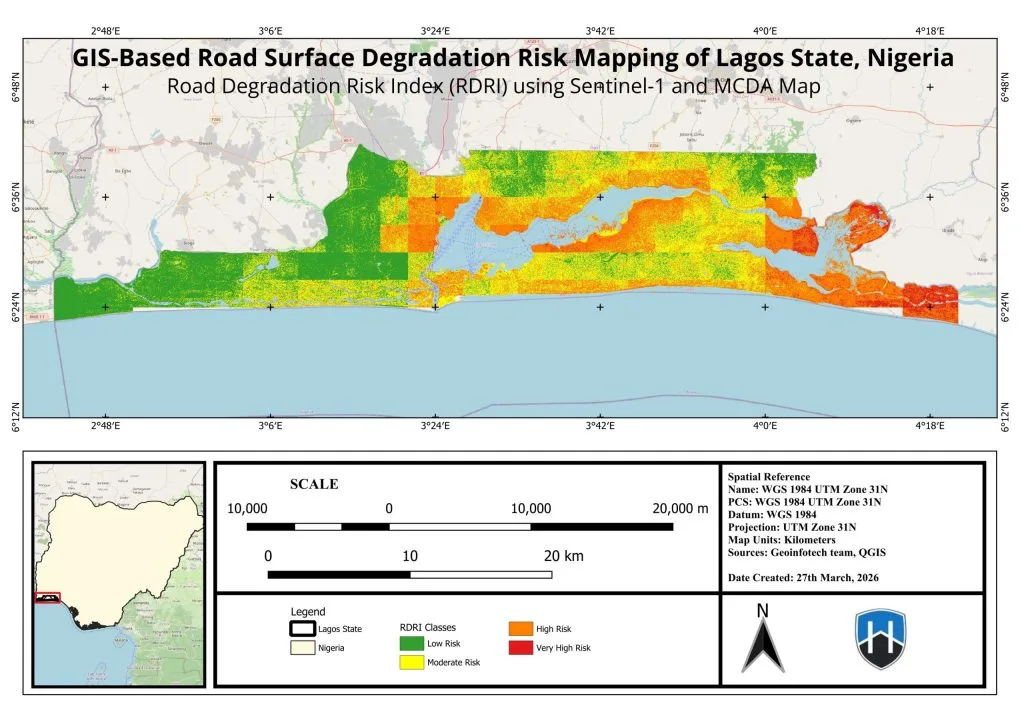
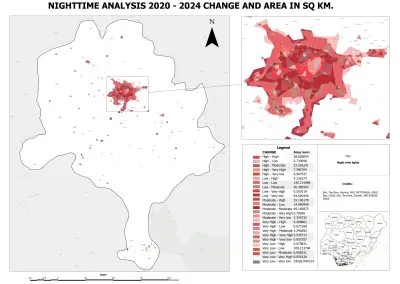
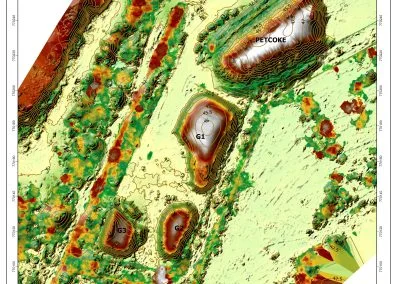
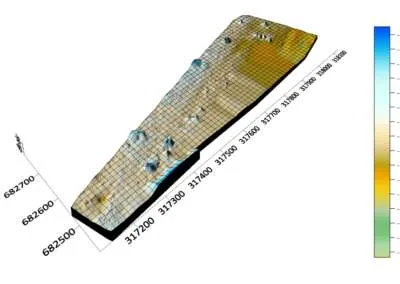
■ IMAGE: Lagos Road Degradation Risk Index Map — Four-Class Classification Across All 20 LGAs
The Findings: One in Four Lagos Roads Is in Trouble
The numbers tell a clear story. Of the 82,992 road segments we assessed, nearly a quarter are in serious danger.
- Low Risk: 7,829 km — 43.5% of the network. Good news.
- Moderate Risk: 5,754 km — 32%. Not safe. These become tomorrow’s problem without action.
- High Risk: 4,346 km — 24.1%. Needs attention now.
- Very High Risk: 53 km — 0.3%. These roads are in genuine crisis.
That Moderate category deserves a second look. 5,754 kilometres of road where risk factors are already building. Without preventive maintenance, those roads migrate into the High-risk category. The data is partly a warning, not just a diagnosis.
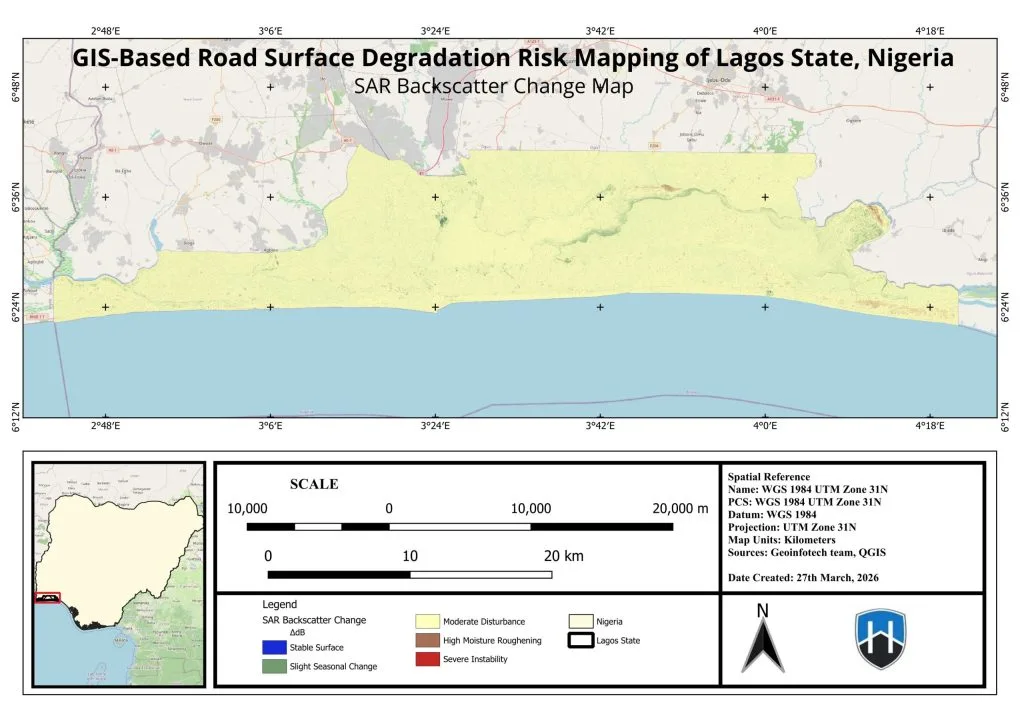
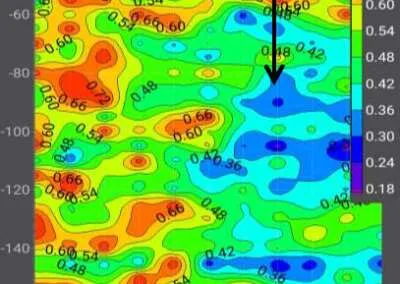
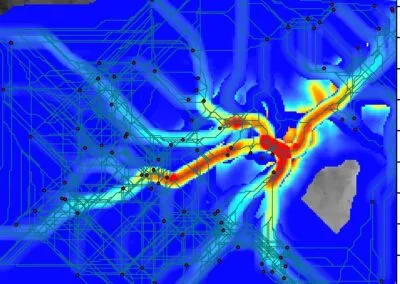
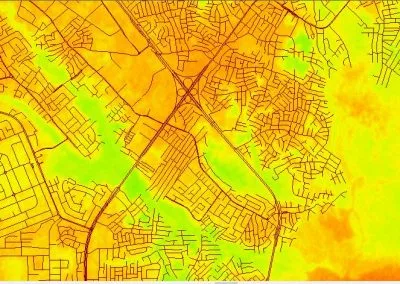
■ IMAGE: Sentinel-1 SAR Backscatter Change Map — Wet Season vs Dry Season Across Lagos
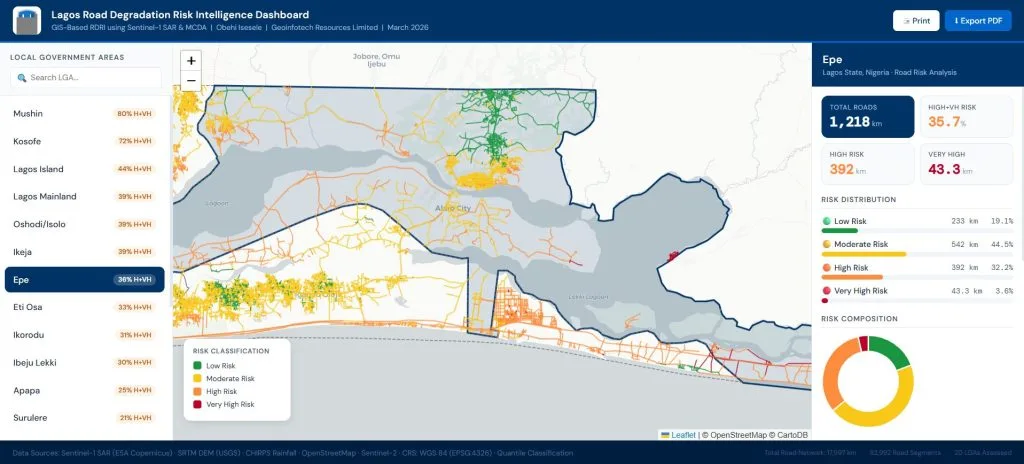
The Five Worst LGAs for Road Degradation in Lagos
1. Shomolu — 100% High or Very High Risk
Every single kilometre. One hundred percent. Shomolu is low-lying, close to Gbagada Lagoon, densely built, and has minimal drainage. This is not a data anomaly. It is a system failure.
2. Mushin — 80% High or Very High Risk (327 km)
Dense, low-lying, persistently waterlogged. Approximately 262 km of its road network sits in the critical categories. Mushin drives a lot of Lagos commerce. Its roads are not keeping up.
3. Kosofe — 72% High or Very High Risk (697 km)
Third on percentage but first on sheer volume. About 502 km of at-risk roads. By scale alone, Kosofe may be the city’s biggest rehabilitation challenge.
4. Lagos Island — 44% High or Very High Risk (142 km)
High water table, coastal position, older pavement carrying far more traffic than it was built for. Lagos Island’s road problem is structural, not just surface-level.
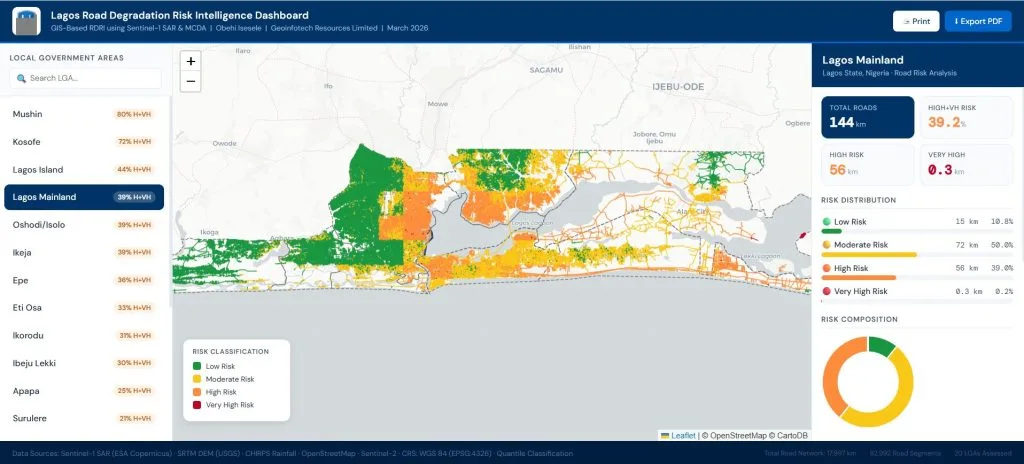
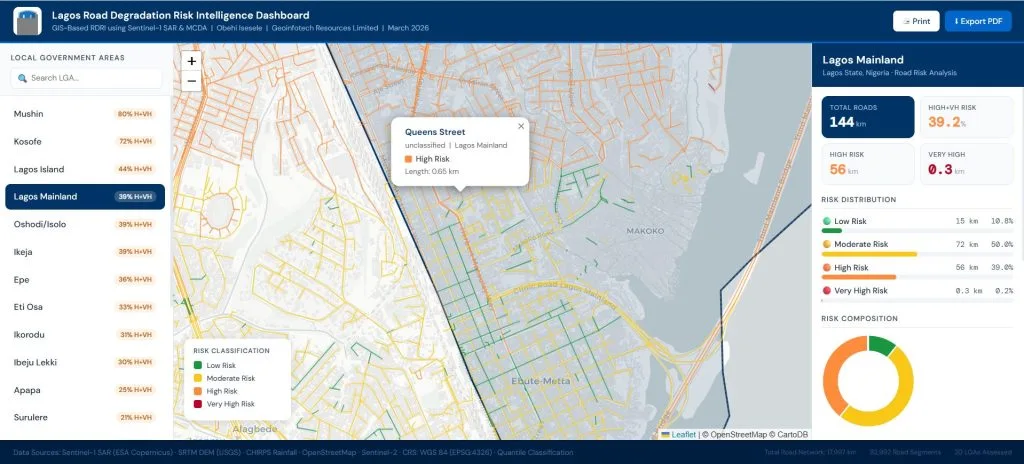
5. Lagos Mainland — 39% High or Very High Risk (144 km)
Adjacent to major drainage corridors and sharing moisture-loading characteristics with its higher-ranked neighbours. The lower ranking reflects a more varied road condition profile, not an absence of urgency.
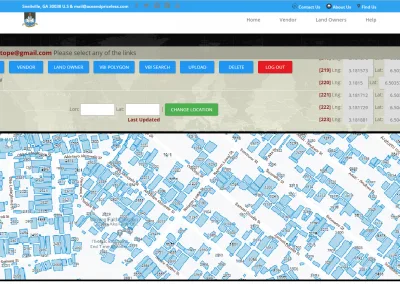
We Also Built a Dashboard. No GIS Skills Required.
A map sitting in a research report helps nobody. So the final deliverable is an interactive Road Degradation Risk Intelligence Dashboard — a single HTML file. No server or internet connection needed or GIS software. You open it on any laptop.
It has three panels. The left panel ranks all 20 LGAs by risk. Click any LGA and the centre map updates instantly, colour-coded by risk class down to individual road segments. The right panel generates an intelligence card for that LGA, road lengths by risk class, dominant risk factor, most vulnerable corridors, and the full MCDA methodology for transparency.
There is also a Print and Export PDF button. A government official can walk into a budget meeting, open the file on a USB stick, click Shomolu, and hand the room a print-ready briefing in under a minute.
■ IMAGE: Road Degradation Risk Intelligence Dashboard — Three-Panel View Showing All 20 Lagos LGAs
So What Does This Actually Mean for Lagos?
To be clear: the RDRI is a risk proxy index, not a physical road condition survey. It has not been validated with field roughness measurements across the full network. However, what it does deliver — and what the methodology supports — is a spatially consistent, satellite-derived answer to the triage question: given limited budgets, where do you look first for Lagos road degradation? The answer: Shomolu. Then Mushin. Before Kosofe. Then the 5,754 km of Moderate-risk roads that are quietly accumulating damage right now.
The secondary finding is just as important: this entire analysis used free satellite data and open-source software. Consequently, it is fully replicable for Abuja, Kano, Port Harcourt — any Nigerian city that needs evidence-based road management but cannot afford expensive surveys.
Lagos deserves infrastructure planning built on data, not decibels. This project proves the data exists. The question now is whether the people who make decisions will use it.
The satellite has already mapped Lagos. The only question is whether Lagos is ready to listen.