TITLE: URABN HEAT ISLAND EFFECT IN CALABAR MUNICIPAL: A COMPARATIVE ANALYSIS OF URBAN TEMPERATURE VARIATIONS BETWEEN YEAR 2014 AND 2024
BY: FOLORUNSO OLUSOLA MERCY
INTRODUCTION
The Urban Heat Island (UHI) effect refers to the phenomenon where urban areas experience higher temperatures than their rural surroundings, primarily due to human activities, dense infrastructure, and land surface modifications. This study focuses on UHI analysis within
Calabar Municipality, a region experiencing rapid urbanization and increasing built-up areas.
Calabar Municipality is located between latitudes 4°15′ and 5°00′ North and longitude 8°25′ East. Geographically, it is bounded to the north by Odukpani Local Government Area, to the north-east by the Great Kwa River, and to the south by the Calabar River and Calabar South Local Government Area.
This Urban Heat Island (UHI) study was conducted to evaluate the spatial distribution of heat within Calabar Municipality and to analyze the impact of urbanization over a ten-year period by comparing Landsat imagery from 2014 and 2024. The primary aim is to support urban planners and policy-makers by identifying areas most affected by elevated land surface temperatures (LST) and understanding the changes in thermal patterns over time. The findings highlight regions with intense heat signatures, which correlate with densely built-up zones, thereby revealing the strong relationship between urban development and the intensity of the UHI effect.
METHODOLOGY
Data Collection
- Acquisition of Satellite Imagery: Multispectral satellite imagery, Landsat 8 obtained from the United States Geological Survey (USGS) Earth Explorer platform. These images provided both thermal and reflective bands necessary for analyzing land surface temperature (LST).
- Land Surface Temperature (LST) Values: The thermal bands from the satellite imagery were used to calculate the land surface temperature of the study area. Radiometric correction, Top of Atmosphere (TOA) data, Normalized Differences Vegetative Indexes (NDVI), LSE were applied to derive accurate LST values.
- Geospatial Analysis: GIS software, ArcGIS Pro was used to overlay the LST maps. This analysis enabled the identification of spatial patterns and relationships between land surface temperature and urban development within Calabar Municipality. Data Interpretation and Mapping: The processed data were used to generate thematic maps showing temperature distribution and urban heat concentration. These maps provided visual insights into the extent of the UHI effect across different zones within the municipality.
- Ground Truthing and Validation: Field visits and high-resolution basemaps were used to validate the result and confirm the accuracy of land use types in the study area. Ground truth data also helped in refining classification results.
Tools and techniques used for analysis
The analysis of the Urban Heat Island (UHI) effect in Calabar Municipality involved the use of remote sensing and GIS tools such as ArcGIS Pro software and Google Earth Engine, along with spatial statistical techniques. The key tools and methods used include:
Remote Sensing Tools:
Landsat 8 OLI/TIRS Satellite Imagery: Acquired for the extraction of thermal and spectral data, necessary for calculating land surface temperature (LST) and identifying land use/land cover (LULC) patterns.
USGS Earth Explorer:
Used as the source for downloading satellite imagery.
Geographic Information System (GIS) Tools: ArcGIS Pro
- Utilized for spatial analysis, image processing, classification, and map production.
- These platforms were essential for generating LST maps and spatial overlays.
- Raster Calculator: The Raster Calculator tool in ArcGIS Pro was employed to compute the Urban Heat
- Island (UHI) Index using the formula: UHI Index= LST−μ / σ Where: LST is the land surface temperature of each pixel, μ is the mean LST of the study area, o σ is the standard deviation of LST.
This formula helped to standardize and highlight areas experiencing higher than average heat levels.
- Google Earth Pro: Used for cross-checking classified land cover types and for visual ground-truthing.
FINDING AND ANALYSIS
Interpretation of key results
The findings clearly show that UHI effects are more pronounced in built-up zones, such as the areas indicated in red and green. These areas exhibited significantly higher surface temperatures compared to vegetated or water-covered regions, represented by blue and light blue tones.
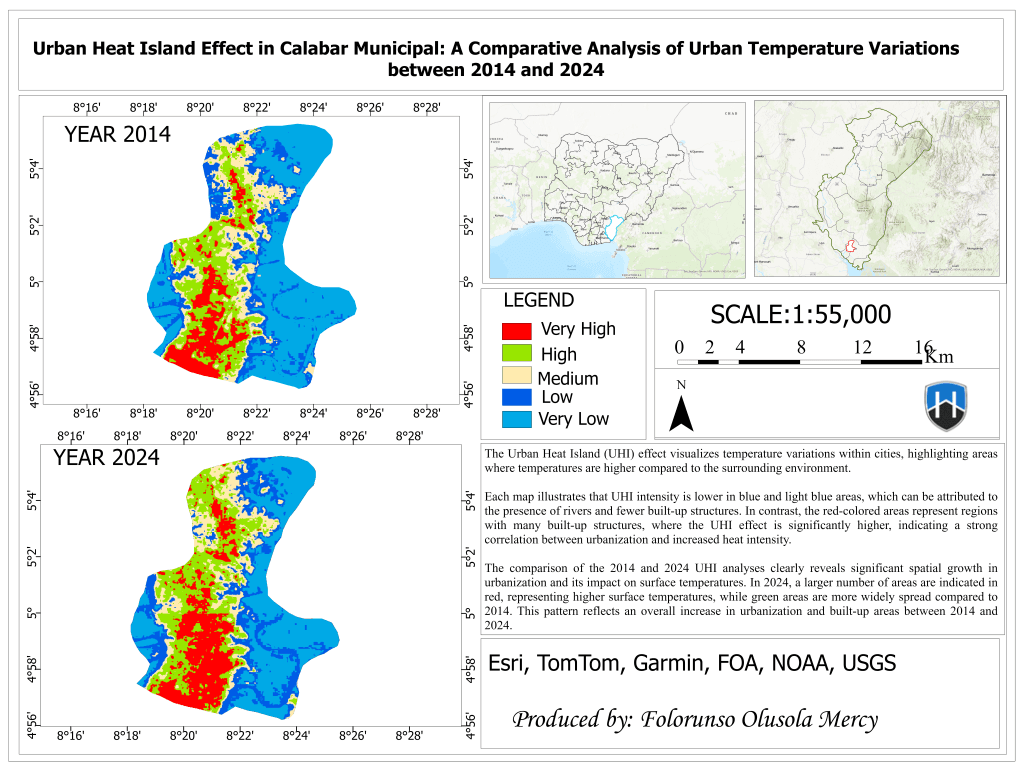
A comparison between the 2014 and 2024 datasets reveals a substantial increase in urbanization by 2024, with a corresponding intensification of surface temperatures in newly developed areas. This highlights the growing influence of urban expansion on local thermal environments. Furthermore, vegetated areas and locations near water bodies—such as the Calabar River— consistently displayed cooler temperatures (blue and light blue regions), reaffirming the cooling influence of natural features and the importance of preserving green and aquatic zones in mitigating UHI effects.
Implications of Findings
The results of this study highlight the presence and spatial variation of the Urban Heat Island (UHI) effect in Calabar Municipality. Areas with highly human activity consistently exhibited higher land surface temperatures. This has several implications:
- Urban Planning: The findings emphasize the need for heat-sensitive urban planning. Identifying high-UHI zones can help planners implement cooling strategies such as green roofing, urban greening, and reflective building materials.
- Public Health: Prolonged exposure to high surface temperatures can lead to heat related illnesses. Populations living in UHI hotspots may be more vulnerable, particularly the elderly, children, and those with existing health conditions.
- Environmental Sustainability: Continued urban development without green infrastructure can exacerbate the UHI effect. These findings underscore the importance of maintaining vegetation and preserving natural areas to mitigate heat buildup.
- Infrastructure Design: Materials used in roads, buildings, and pavements should be re-evaluated to include heat-reducing designs. Urban infrastructure must consider thermal comfort as a core component.
Challenges or Limitations Encountered
Several challenges were encountered during the course of this study, including:
- Limited Ground Truth Data: The study relied heavily on remote sensing data.
- Cloud Cover and Atmospheric Interference: Satellite imagery, especially in tropical regions like Calabar, is sometimes affected by cloud cover, limiting the clarity of thermal readings.
- Resolution Constraints: Landsat 8 imagery has a thermal band resolution of 100m (resampled to 30m), which may not capture very fine-scale temperature variations in urban microclimates.
- Time Constraints: The study focused on a specific time period (one image dates), which may not capture seasonal UHI variations.
Possible Alternative Solutions
To overcome these challenges and enhance future UHI assessments, the following alternative strategies are suggested:
- Use of High-Resolution Imagery: Employing data from sensors like Sentinel-3 SLSTR or commercial platforms (e.g., Planet Scope) could provide more precise temperature data.
- In-situ Data Collection: Deploying temperature sensors or collaborating with local meteorological stations can provide ground-based LST validation for increased accuracy.
- Temporal Analysis: Conducting a time-series analysis using multi-date imagery would help reveal seasonal trends and long-term UHI changes.
- Public Policy Integration: Encourage collaboration between environmental
researchers, local government, and urban planners to integrate UHI data into environmental and developmental policymaking.
Practical Recommendations Based on Findings
In light of the results, the following recommendations are proposed to mitigate UHI effects and promote sustainable urban development in Calabar Municipality:
- Increase Urban Vegetation:
- Promote tree planting and the establishment of parks and green corridors, especially in high-UHI zones. o Encourage vertical and rooftop gardens in residential and commercial buildings.
- Sustainable Urban Planning:
- Incorporate heat-mapping data into land use planning to prioritize cooler zones for residential development. o Limit over-concentration of buildings without adequate spacing and ventilation.
- Adopt Heat-Resistant Materials:
- Promote the use of reflective roofing, permeable pavements, and other heat mitigating building materials.
- Public Awareness and Engagement:
- Educate communities about the impact of heat islands and the importance of maintaining green spaces.
- Policy Integration:
- Integrate UHI considerations into local environmental and housing policies through collaboration between government agencies and researchers.